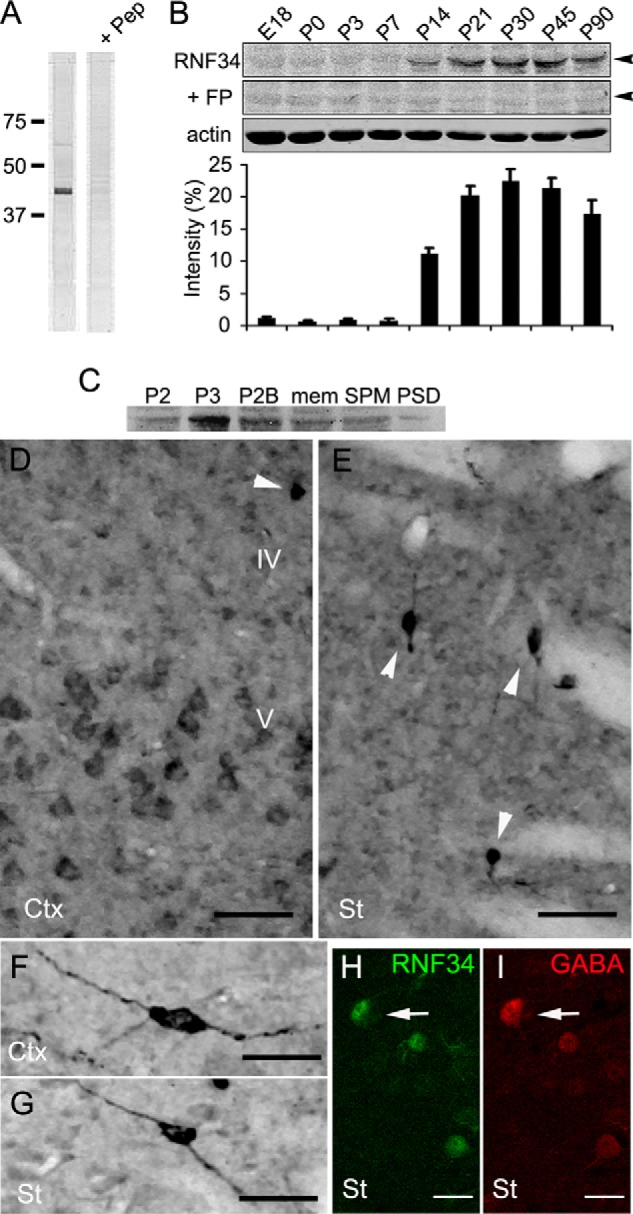
FIGURE 6.

Expression and distribution of RNF34 in the rat brain. A, immunoblot with the Rb anti-RNF34 antibody of the rat forebrain crude synaptosomal (P2) fraction, shows a major protein band ∼42 kDa, which is displaced by 100 μg/ml of the antigenic peptide (+ Pep). 20 μg of the total proteins were loaded into each lane. B, immunoblots of rat forebrain homogenates of various ages from embryonic day 18 (E18) to postnatal day 90 (P90) with Rb anti-RNF34 and Ms anti-actin antibodies. 75 μg of total protein were loaded into each lane. The RNF34 antibody recognizes a 42-kDa protein band (arrowhead), whose immunoreactivity is displaced by incubating the antibody with 100 μg/ml of the purified bacterial His-RNF34 (aa 195–381) fusion protein (+ FP). The bar graph shows the quantification of the relative RNF34 protein expression levels by densitometry of the RNF34 protein band normalized to actin protein band density. C, immunoblot of various rat forebrain subcellular fractions with Rb anti-RNF34 antibody. The RNF34 protein band is present in all the fractions tested, including crude synaptosomal (P2), microsomal (P3), synaptosomal (P2B), total membrane (mem), SPM, and one Triton PSD fractions. 25 μg of the total proteins were loaded into each lane. D and E, RNF34 immunocytochemistry in layers IV and V of the cerebral cortex (Ctx) and corpus striatum (St). Arrowheads indicate neurons with high RNF34 immunoreactivity. F and G, individual neurons with high level of RNF34 immunoreactivity in the cerebral cortex and striatum, respectively. H and I, double label fluorescence confocal microscopy of corpus striatum from rat brain sections immunolabeled with anti-RNF34 (green in H) and anti-GABA (red in I). GABA+ interneurons show a high expression level of RNF34 protein (arrow). Scale bar, 50 μm (D and E), 25 μm (F and G), and 20 μm (H and I).
