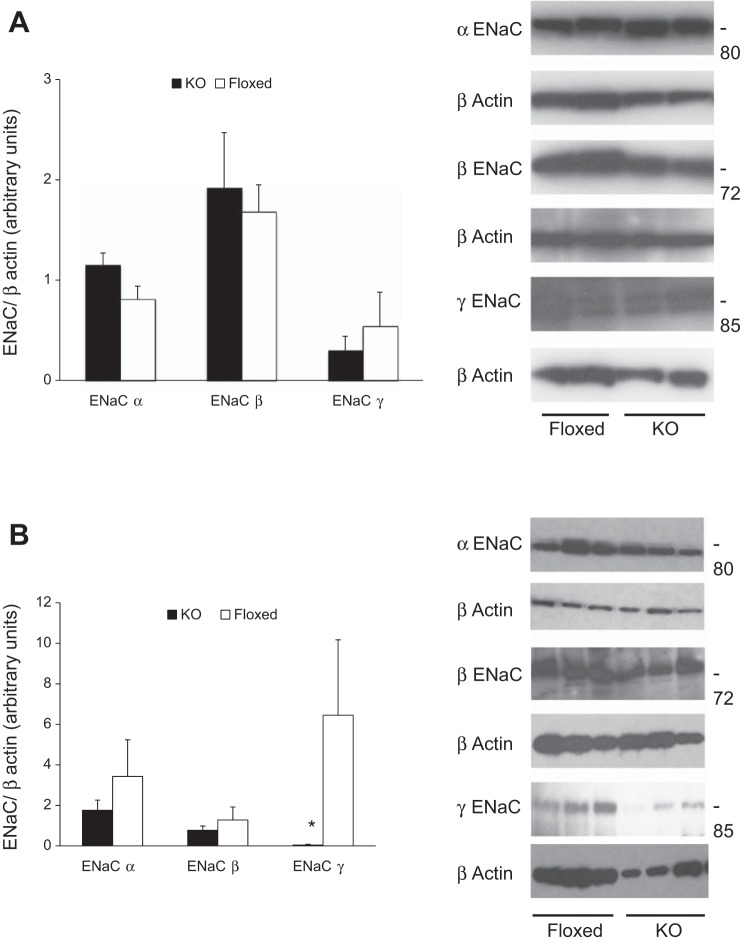
Fig. 6.
Kidney epithelial sodium channel (ENaC) protein content in CD renin KO and floxed mice on a normal-Na+ diet. A: before ANG II infusion. Left: plasma membrane-enriched ENaC protein levels by densitometry (n = 5 each group). Right: representative Western blots of plasma membrane-enriched ENaC isoform (n = 2 each group). B: following ANG II infusion. Left: plasma membrane-enriched ENaC protein levels by densitometry (n = 5 each group). Right: representative Western blots of plasma membrane-enriched ENaC isoform (n = 3 each group). *P < 0.05 comparing with floxed mice.

