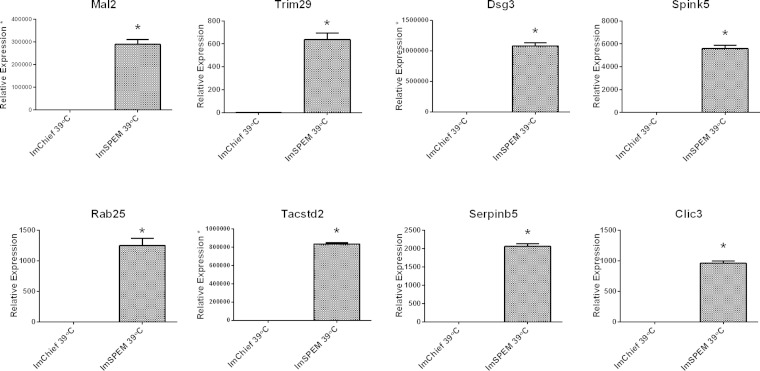
Fig. 6.
Validation of select transcripts upregulated in ImSPEM cells by qRT-PCR. From the list of top upregulated transcripts identified by microarray analysis, 8 transcripts were selected for further validation. Transcription expression levels in ImChief and ImSPEM cells cultured at 39°C for 1 wk were measured by qRT-PCR. Expression levels are shown as a ratio of the mean expression in ImChief cells. All 8 transcripts were significantly upregulated in ImSPEM cells compared with ImChief cells. For Mal2, Dsg3, and Tacstd2, expression levels in ImChief did not meet the cycle threshold for detection. Thus, for quantification of these 3 transcripts, ImChief detection levels were set to cycle 40 (as marked by an asterisk on the y-axis label). These data confirm the significant upregulation of these 8 transcripts identified by the microarray comparison; n = 3 and *P = 0.05.

