Fig. 3.

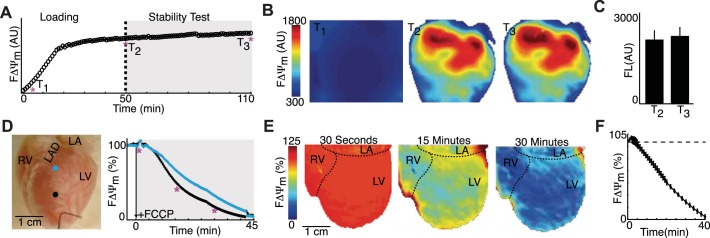
Dye stability test and targeted ΔΨm depolarization. A: representative FΔΨm signals during the dye stability test. B: spatial FΔΨm maps early in dye loading (T1) as well as at the beginning (T2) and end (T3) of stability testing. C: FΔΨm intensity (FL) at T2 and T3 (n = 4 mice). D: representative rabbit heart showing the spatial location of FΔΨm signals (right) during targeted depolarization with FCCP administration. E: FΔΨm maps at 30 s, 15 min, and 30 min after FCCP administration. F: summary (n = 5 rabbits) of epicardial FΔΨm. All data are expressed as means ± SE. AU, arbitrary units; RV, right ventricle; LV, left ventricle; LA, left atrium; LAD, left anterior descending coronary artery.
