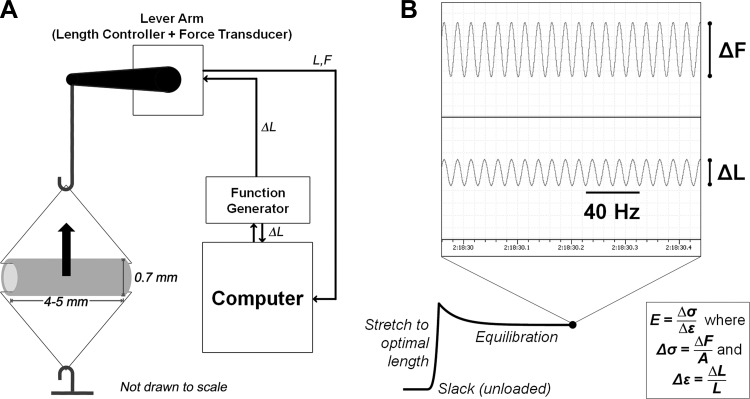
Fig. 1.
In vitro steady-state stiffness methods. A: schematic of lever arm for stiffness measurements; steady-state force response measured from stretching the tissue sample (shown here with typical unloaded in vitro geometry) is that which is experienced in the circumferential direction at the center of the axial cross section (arrow). B: representative force trace with sample inset of electronic recordings for high-frequency, low-amplitude (HFLA) oscillatory stretch; sinusoidal length input (ΔL) and force output (ΔF) were used to calculate stiffness at optimal length L. Stiffness E is the ratio of change in stress (Δσ, equivalent to ΔF normalized to cross-sectional area A) to change in strain experienced by tissue (Δε).

