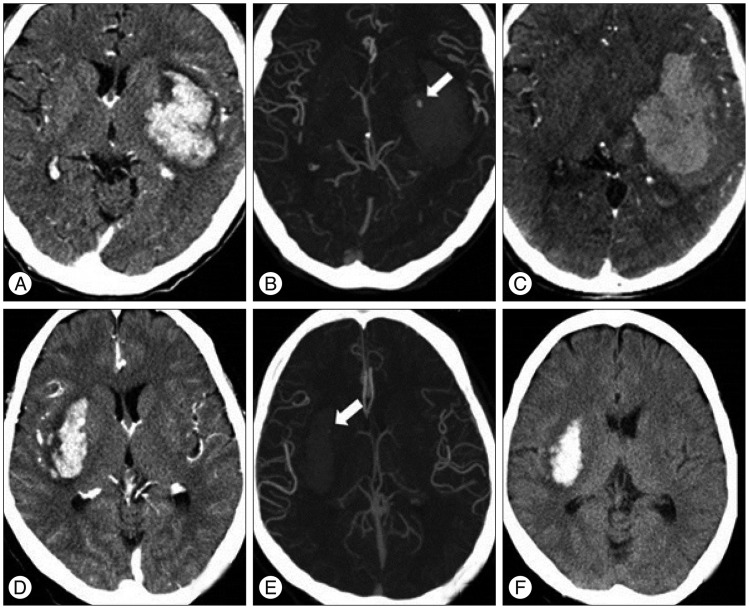
Fig. 1.
CT angiograms of two spot sign positive patients with and without hematoma expansion. Brain CT scans demonstrate basal ganglia hemorrhage. The upper row CT images of a 47-year-old female display hematoma expansion 2 hours after presentation with a spot sign of 3.63 mm and a density of 194 Hounsfield units (HU) (A, B, and C). The lower row CT images of a 61-year-old male show no hematoma expansion 24 hours after presentation with a spot sign of 1.21 mm and a density of 117 HU (D, E, and F).

