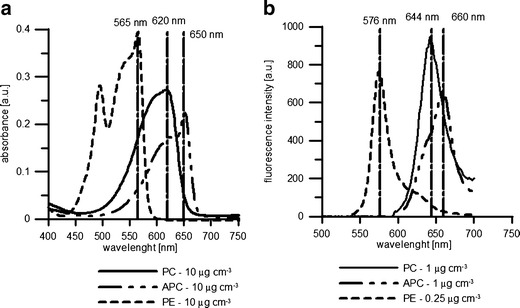
Fig. 1.

Examples of absorption (a) and fluorescence (b) spectra of phycobilin pigment standards obtained for known pigment standard concentrations. Fluorescence emission spectra of PC obtained for excitation at 590 nm, APC (600 nm), and PE (530 nm) at a lamp intensity set to 800. The marked wavelengths correspond to the maximum values of a absorbance and b emission
