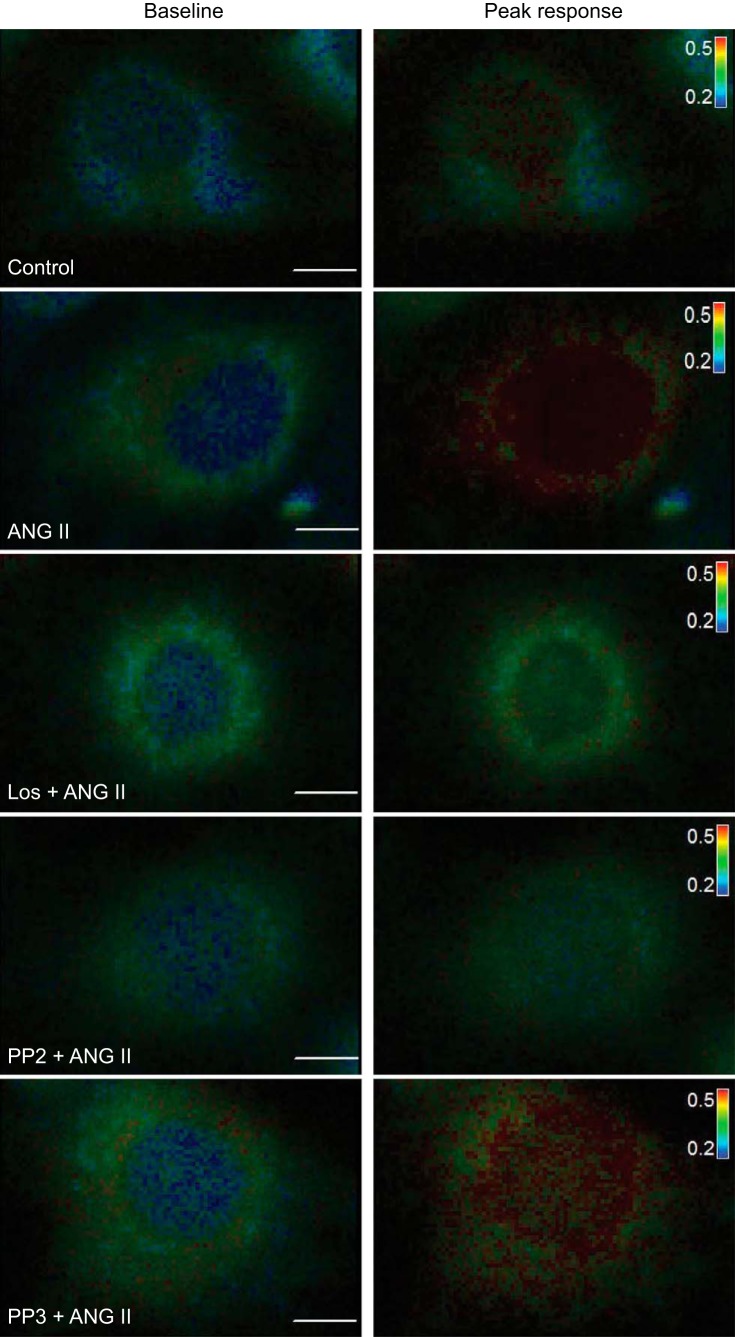
Fig. 5.
Representative 4B cells loaded with Fura-2 AM and pseudocolored showing 340 nm-to-380 nm ratio. First image of respective groups shows the cell during baseline and the second image shows the cell during peak calcium response after 20 nM GSK 101 administration. Scale bar: 10 μm. The inset table is color scale for changes in the 340 nm-to-380 nm ratio (0.2–0.5).

