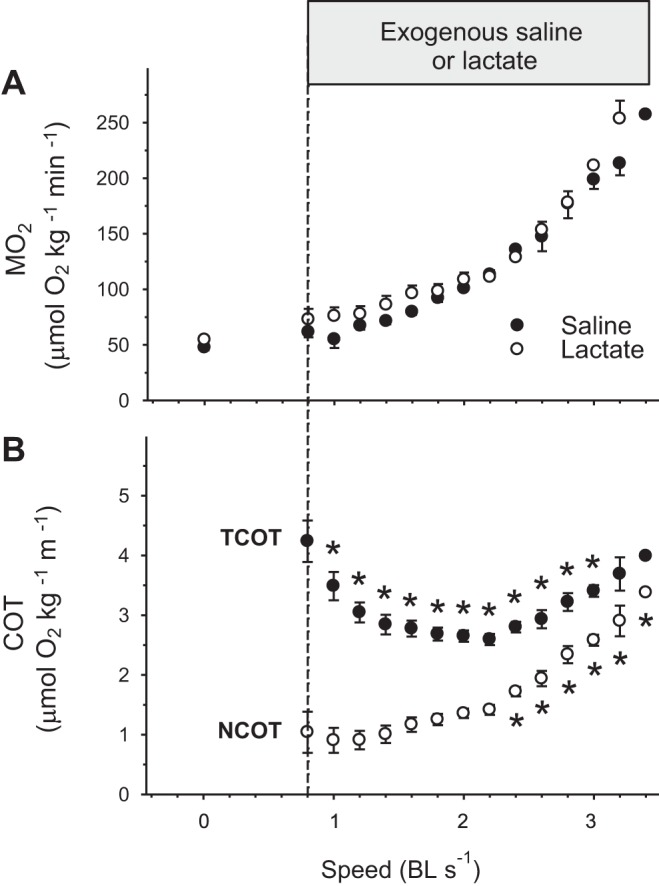
Fig. 3.

A: MO2 during a critical swimming speed (Ucrit) test for rainbow trout receiving exogenous saline (control; ○) or exogenous lactate (●). Ucrit was not different between the controls [2.9 ± 0.2 body lengths/s (BL/s)] and the lactate group (2.8 ± 0.2 BL/s) (P = 0.33). B: because MO2 was not different between groups (P = 0.81), pooled MO2 values were used to calculate total cost of transport (TCOT; ▲) and net cost of transport (NCOT; △). Values are expressed as means ± SE (n = 8 for lactate and 9 for saline) (n = 17 for TCOT and NCOT). *Significant difference from baseline (0.8 BL/s), P < 0.01.
