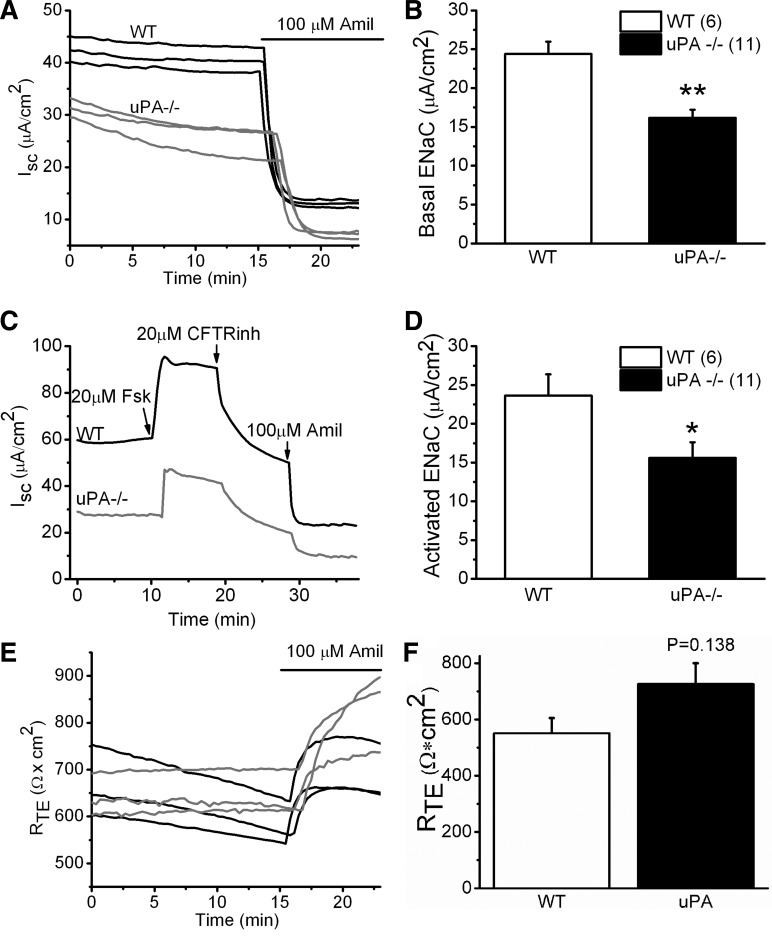
Fig. 2.
Bioelectrical profile of mouse tracheal epithelial (MTE) monolayers. A: Isc. The Isc values in WT (black) and uPA−/− (light gray) cells were measured with an 8-chamber Ussing apparatus in parallel. Amiloride (Amil; 100 μM) was added to determine the amplitude of ENaC channels. These recordings were repeated, and similar results were observed. B: basal ENaC activity. ENaC activity was calculated as the amiloride-sensitive fraction, the difference between the Isc values recorded before and after addition of amiloride. **P < 0.01. The number of monolayers for each group is included in parentheses. C: cyclic AMP (cAMP)-activated ENaC currents. ENaC activity was evoked by a cAMP-elevating reagent, forskolin (Fsk), in the luminal compartment. CFTRinh-172 was applied to the apical chamber to remove the cAMP-stimulated CFTR current. D: cAMP-elevated ENaC activity in WT. *P < 0.05. N = 6–11. E: transepithelial resistance (RTE). The resistance values of monolayers were recorded simultaneously for both WT (black) and uPA−/− cells (light gray). F: summary of RTE. N = 12 independent experiments.

