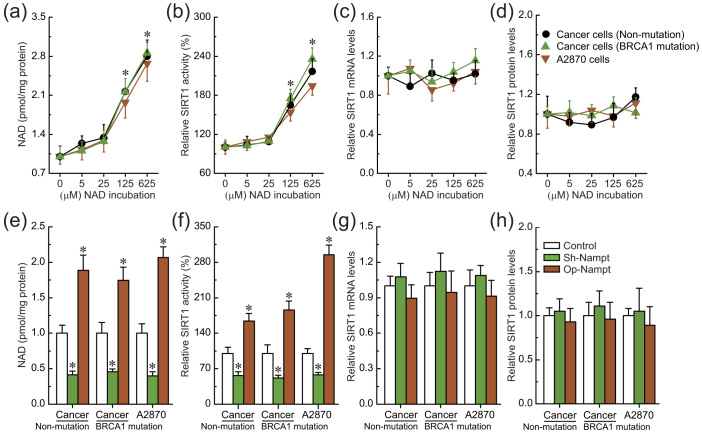
Figure 4. Effects of intracellular NAD on SIRT1 expression and activity.
(a–d), Relative NAD levels, SIRT1 activity, and SIRT1 mRNA and protein levels after incubation with different concentrations of NAD in A2780 cells (repeated 12 times) and primary non-BRCA1-mutated and BRCA1-mutated ovarian cancer cells (n = 12). 1–5: incubation with 0, 5, 25, 125, or 625 μM NAD. Bar graphs show mean ± SD. * P < 0.05 vs. control. (e–h), Relative NAD levels, SIRT1 activity, and SIRT1 mRNA and protein levels after knockdown or overexpression of Nampt in A2780 cells (repeated 12 times) and primary non-BRCA1-mutated and BRCA1-mutated ovarian cancer cells (n = 12). Bar graphs show mean ± SD. Sh, shRNAs; Op, overexpression. * P < 0.05 vs. control.

