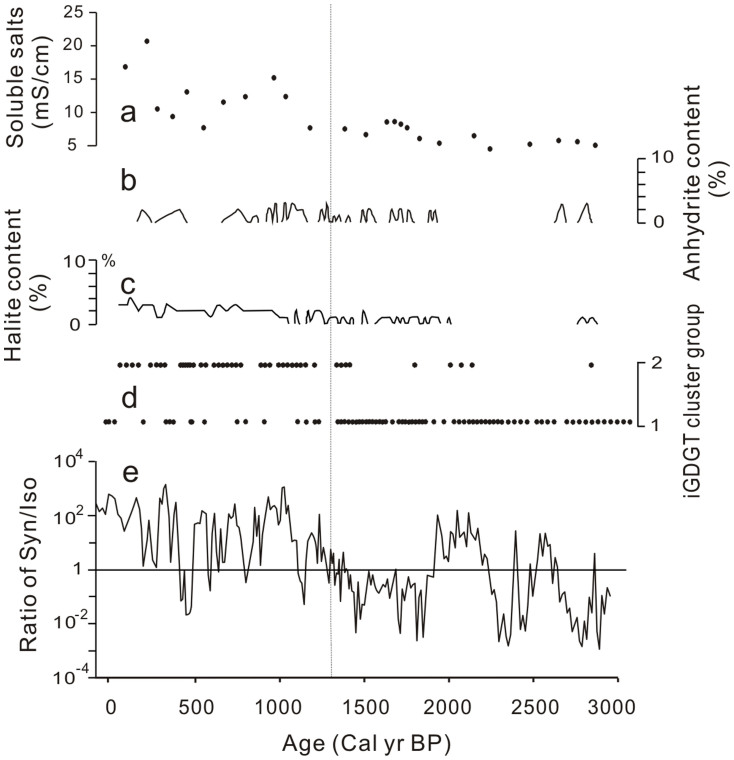
Figure 7. Temporal changes in the abundance ratio of Synechococcus over Isochrysis in relation to salinity as indicated by: (a) sediment soluble salt content36; (b) abundance of anhydrite5; (c) abundance of halite5; (d) iGDGT cluster group; (e) the abundance ratio of Synechococcus over Isochrysis as determined by qPCR of the 23S rDNA fragment.
The vertical dashed line refers to the time when the abundance ratio changed from mostly <1 to >1.

