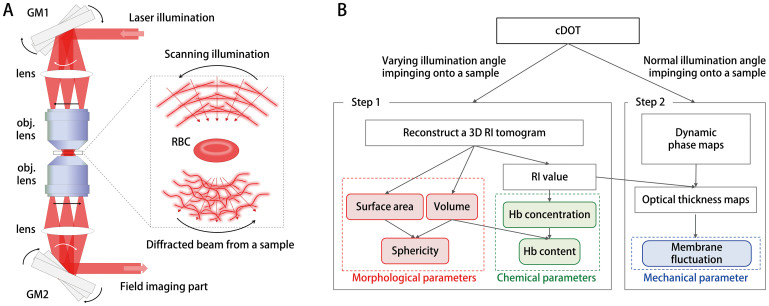
Figure 1. Principle of cDOT and the analysis procedure for individual RBCs.
(A) The cDOT setup is composed of two galvanometric mirrors (GM1, GM2) synchronized with each other and a field imaging part. A sample is positioned between two objective lenses. GM1-2: two-axis galvanometric mirrors. The angle of an illumination beam impinging onto the sample is scanned by rotating GM1 and is de-scanned by GM2 in a synchronized manner such that the angle of the beam reflected from GM2 remains unchanged. The sample is illuminated with a plane wave at different angles of illumination. (B) Schematic diagram of the analysis procedure for retrieving the red cell indices for individual RBCs using cDOT.

