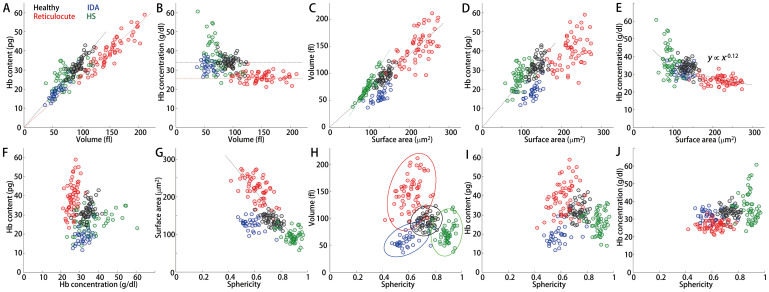
Figure 4. Correlation maps between the morphological and chemical parameters for the healthy, IDA, reticulocyte, and HS red blood cells; correlation analyses between (A) volume and Hb content, (B) volume and Hb concentration, (C) surface area and volume, (D) surface area and Hb content, (E) surface area and Hb concentration, (F) Hb concentration and Hb content, (G) sphericity and surface area, (H) sphericity and volume, (I) sphericity and Hb content, and (J) sphericity and Hb concentration.
The dotted lines are shown for guidance of linear relationships.

