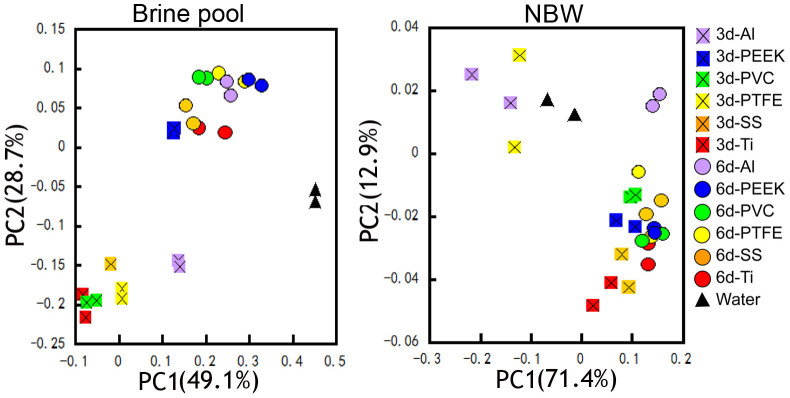
Figure 4. Similarity of microbial communities from water and biofilm samples, as illustrated by the OTU composition and abundance-based PCoA plot.

Community similarities in the brine pool and NBW are shown. The eigenvalues (percentage variance for the first two principal components) are indicated in the figure.
