Figure 1.
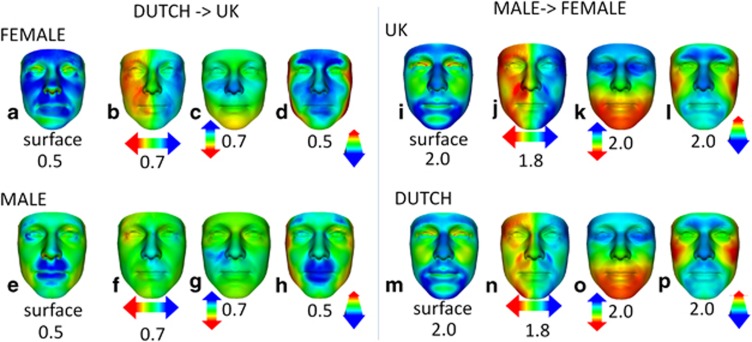
Colour-coded heat-map comparisons. Heat-map comparisons showing the shape differences (red–green–blue colour code spectrums) of the Dutch mean female face normalised against all UK female faces (a–d), of the Dutch mean male face normalised against all UK male faces (e–h), of the UK mean male face normalised against all UK female faces (i–l) and of the Dutch mean male face normalised against all Dutch females (m–p). The first of each group of four columns is a heat-map comparison of the raw mean faces, reflecting displacement normal to the face surface. Heat-map comparisons parallel to three orthogonal axes are given in the second (x axis), third (y axis) and fourth (z axis) columns. Colour-coded differences are depicted in standard deviations and correspond to the colour scales at±the range indicated. In the male>female comparisons, the degree and regional location of differences between the Dutch and UK are very similar, except that the former are slightly reduced in degree. In the Dutch>UK comparisons, the differences for the female mean faces are greater and in different locations than those for the male mean faces.

