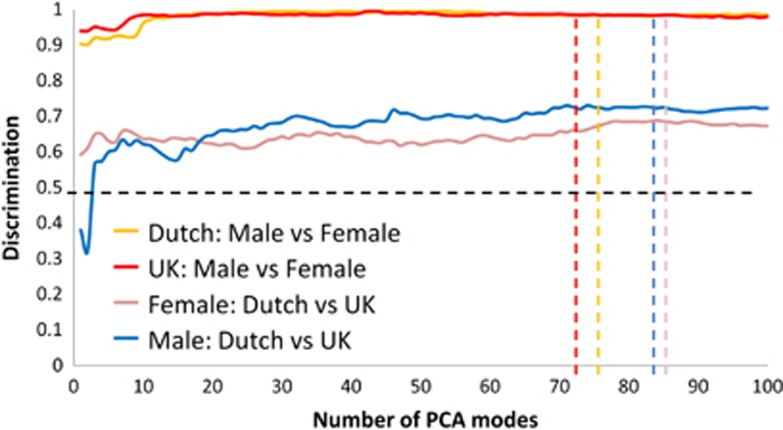
Figure 2.
Rates of discrimination between gender-ethnic subpopulations. In order to determine discrimination rates between the faces of particular sex-ethnicity subgroups multi-folded cross-validation was undertaken using closest mean classification. Overall discrimination was calculated as the mean of the AUC estimates for the multiple cross-validation results. AUC corresponds to the probability of correctly classifying a randomly selected pair of subjects, one from each classification subgroup. If there were no significant differences between the face shape of two subgroups being compared, then the expected AUC would be 0.5 as indicated by the horizontal broken line. The vertical broken lines indicate the number of modes in the dense surface models used corresponding to 99% of shape variation from the mean face.

