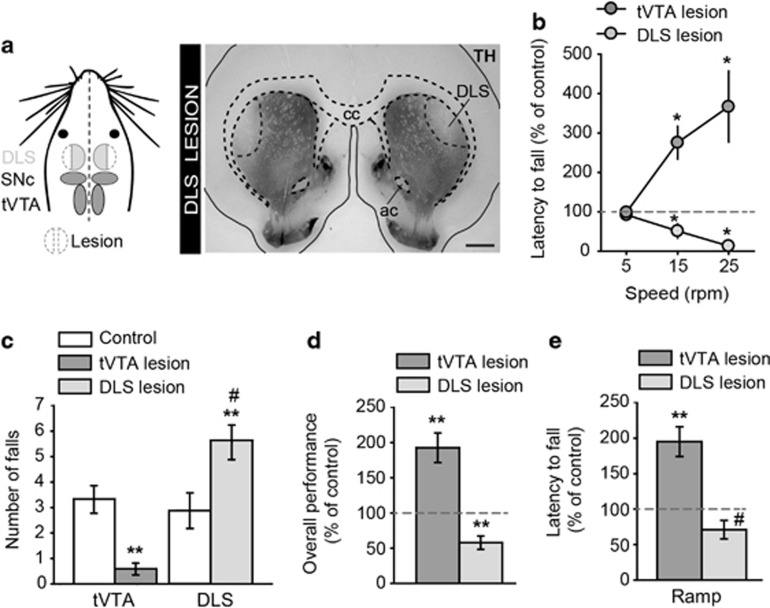
Figure 5.
Comparison of motor performances between tVTA and dorsolateral striatum lesions. (a) Experimental protocol and histological evidence for bilateral DLS lesion with 6-OHDA. (b) Latency to fall of bilateral tVTA and DLS-lesioned animals in a rotarod task at fixed speed (tVTA, n=10, DLS, n=11; referred to 100%, *p<0.05. (c) Number of falls during the first day of rotarod training at low speed (control, n=8–9; tVTA lesion, n=10; DLS lesion, n=11; **p<0.01 compared with controls; tVTA–DLS comparison, #p<0.001). (d) Overall performance comparison corresponding to Figure 5b (**p<0.01 referred to 100%). (e) Latency to fall in a ramp rotarod task (0–45 r.p.m. in 120 s) (tVTA, n=10; DLS, n=11; **p<0.01, #p=0.0507, referred to 100%). Graphs represent mean±SEM. ac, anterior commissure; cc, corpus callosum; DLS, dorsolateral striatum; r.p.m., rotations per minute; TH, tyrosine hydroxylase. Scale bar, 1 mm (a).

