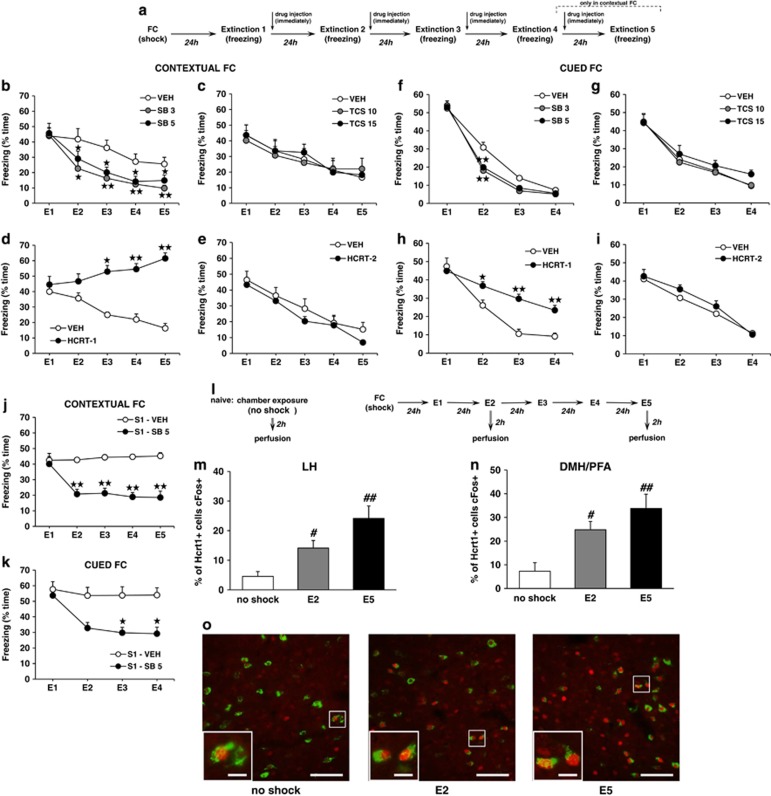
Figure 2.
Hypocretin transmission is involved in the extinction of fear memories through Hcrtr-1 signaling. (a) Schematic representation of the experimental design for (b–k) tests. (b–i) Time course of the freezing levels scored during (b–e) contextual and (f–i) cued extinction trials in mice treated immediately after each extinction session with (b and f) SB334867 (3 and 5 mg/kg, i.p.) or vehicle (n=7–14 mice per group), (c and g) TCSOX229 (10 and 15 mg/kg, i.p.) or vehicle (n=7–8 mice per group), (d and h) hypocretin-1 (0.75 nmol/μl, i.c.v.) or vehicle (n=6–8 mice per group), and (e and i) hypocretin-2 (2.5 nmol/μl, i.c.v.) or vehicle (n=6–7 per group). (j and k) Time course of the freezing levels scored during (j) contextual and (k) cued extinction trials in 129S1/SvImJ mice treated with SB334867 (5 mg/kg, i.p.) or vehicle (n=7–13 mice per group) immediately after each extinction session. (l) Schematic representation of the experimental design for (m–o) biochemical experiments. (m and n) Percentage of hypocretin cells expressing cFos in the (m) LH and the (n) DMH/PFA of mice exposed to the context without receiving any footshock, and mice subjected to FC and subsequent extinction until E2 and E5 (n=5–7 mice per group). (o) Representative images of the DMH/PFA obtained via fluorescence microscopy after direct double labeling combining rabbit polyclonal antiserum to cFos with mouse monoclonal antibody to hypocretin-1. The scale bars represent 40 μm in general images and 10 μm in magnified images. Data are expressed as mean±SEM. *p<0.05, **p<0.01 compared with the vehicle group; #p<0.05, ##p<0.01 compared with the no-shock group. FC, fear conditioning; E1–E5, extinction trials 1–5; VEH, vehicle; SB, SB334867; TCS, TCSOX229; HCRT-1, hypocretin-1; HCRT-2, hypocretin-2; S1, 129S1/SvImJ mice; LH, lateral hypothalamus; DMH/PFA, dorsomedial hypothalamus and perifornical area. A full color version of this figure is available at the Neuropsychopharmacology journal online.

