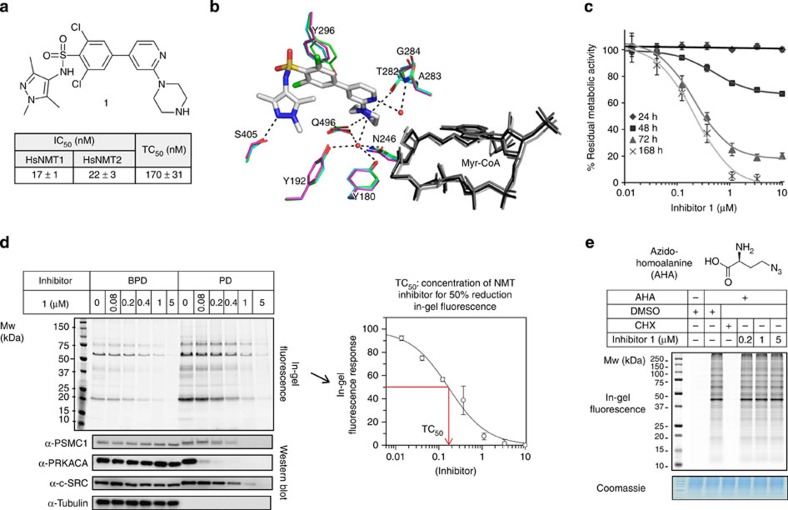
Figure 2. Characterization of potent and selective NMT inhibitors.
(a) Structure and dual NMT1/NMT2 inhibitory potency of compound 1. (b) Crystal structure of 1 (grey) bound to NMT1 in the presence of Myr-CoA showing key water molecules (red spheres) and polar interactions (dashed lines). Key residues (NMT1 numbering) are shown for NMT1 (blue, PDB 4C2Y) and NMT2 (pink, PDB 4C2X), and for NMT1 with 1 bound (green, PDB 4C2Z). Myr-CoA or the Myr-CoA analogue (NHM) is shown in black/grey. Image generated in PyMOL (0.99rc6, DeLano Scientific LLC, http://pymol.sourceforge.net/). (c) Viability (MTS assay) of HeLa cells exposed to compound 1 at concentrations and time points indicated; error bars, s.d. (n=6). (d) Compound 1 inhibits NMT activity dose-dependently in HeLa cells (BPD=before pull-down; PD=after pull-down on streptavidin-coated beads). In-gel fluorescence after YnMyr tagging was quantified (ImageJ) and the response (% relative intensity; error bars, s.d. (n=2)) plotted using GraFit 7.0 to determine TC50 (see Fig. 2a for TC50 determined for compound 1). Western blots against protein substrates of NMT show dose-dependent reduction in enrichment following inhibition (tubulin: non-substrate loading control). (e) Cells treated with azidohomoalanine (AHA), cycloheximide (CHX) or inhibitor 1 (or DMSO vehicle), were lysed and ligated (CuAAC) to an alkyne-TAMRA reagent67. In-gel fluorescence demonstrates inhibition of protein synthesis by CHX, but not by 1.

