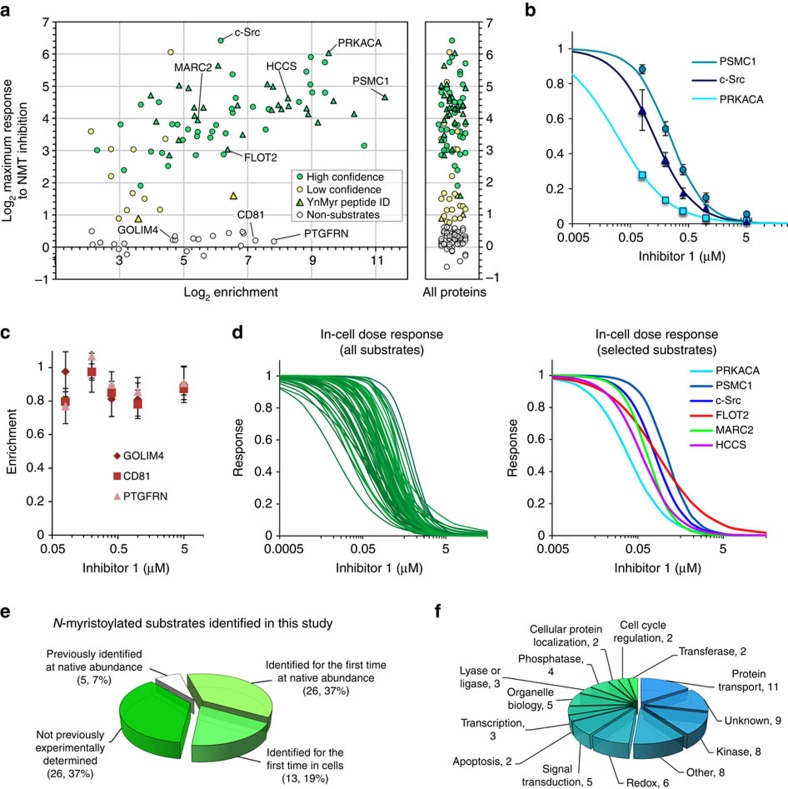
Figure 3. Identification of co-translational NMT substrates in HeLa cells.
(a) Log2-fold change for maximal response of YnMyr enrichment of MG-initiated proteins to NMT inhibition (compound 1, six concentrations, 0–5 μM, n=5) quantified by spike-in SILAC, plotted against enrichment relative to myristic acid fed control (by LFQ, see Supplementary Fig. 2). Circles plot substrates (green), substrates identified with lower confidence/fewer unique peptides (yellow) and non-substrates (grey circle); triangles indicate substrates for which a YnMyr-modified peptide was identified directly by MS/MS using AzRTB and/or AzKTB. Vertical scatter plot (at right) shows responses for all proteins identified, including those lacking quantifiable peptides in the myristate control. (b) Response of enrichment to NMT inhibition quantified by spike-in SILAC for the three known NMT substrates in Fig. 2d; error bars, s.d. (n=5). (c) Enrichment for three non-substrates shows no significant response up to the highest concentration of 1 tested; error bars, s.d. (n=5). (d) Dose-response curves for NMT substrates identified by quantitative chemical proteomics. Plots were generated by non-linear regression of IC50 values and slope factors to a standard dose-response equation (GraFit 7.0). Three known (PRKACA, c-Src and PSMC1) and three novel (FLOT2, MARC2 and HCCS) substrates are highlighted at the right. (e) Proportion of substrates identified here for the first time at their endogenous (native) expression level in live mammalian cells (green slices) vs those previously identified under the same conditions (white slice). (f) Biological functions for 70 NMT substrates identified in this study (Gene Ontology annotations).

