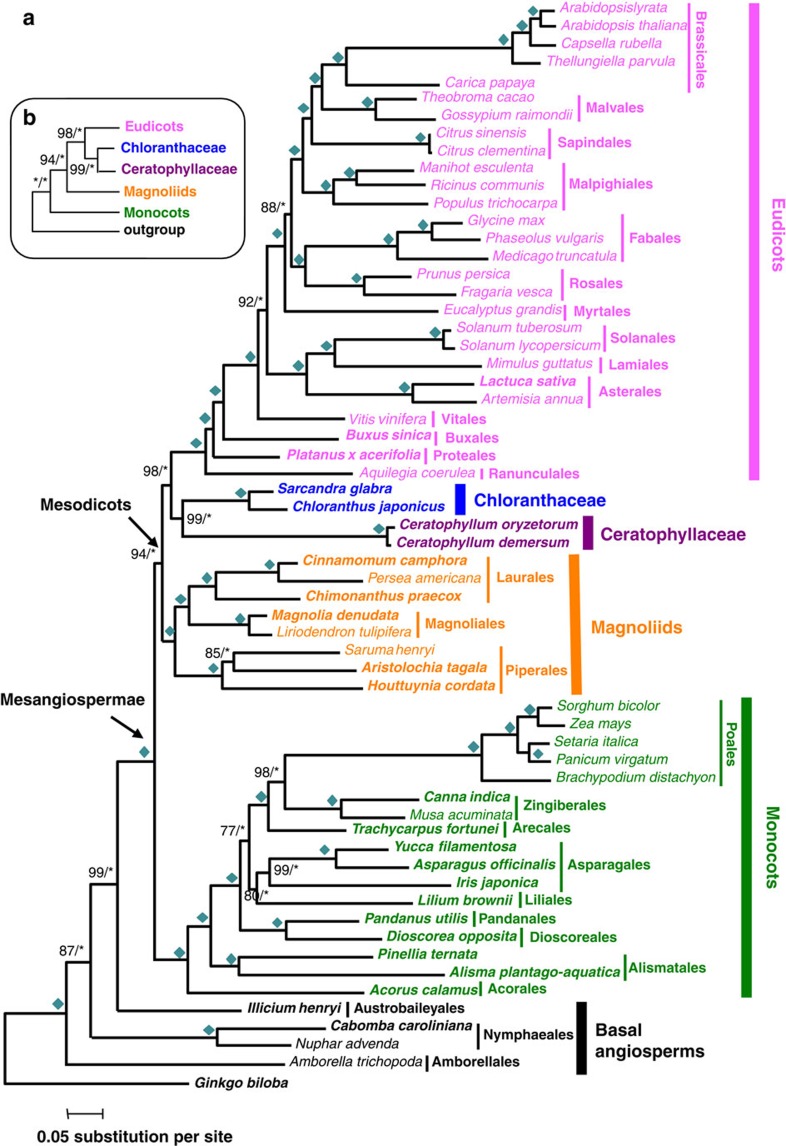
Figure 3. A highly supported hypothesis for relationships among the five major groups of Mesangiospermae.
(a) A phylogeny of 61 taxa using 59 genes. Numbers associated with nodes are the bootstrap value (BS, on the left) obtained by RAxML and the posterior probability (PP, on the right) obtained by MrBayes based on concatenated 59 genes. Asterisks indicate either BS of 100% or PP of 1.0. Diamonds indicate both BS of 100% and PP of 1.0. Taxa with transcriptome data specifically generated for this study are shown in bold. (b) An abbreviated tree showing the relationship of the five lineages of Mesangiospermae, with associated support values (BS/PP).

