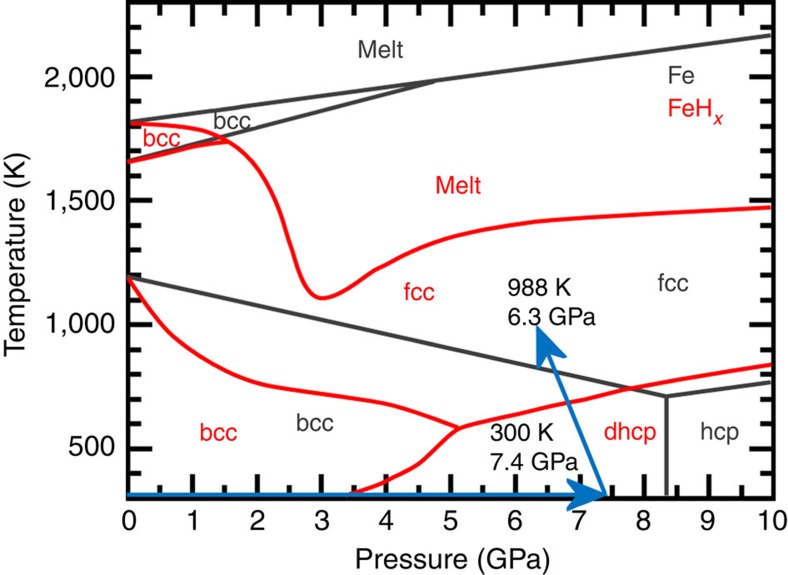
Figure 1. Compression and heating path of the deuterization of iron.
Pressure–temperature phase diagram of FeHx (red lines) and Fe (grey lines), which are reproduced from those presented in refs 2, 3, 4 for FeHx, and ref. 17 for Fe, respectively. In situ neutron diffraction measurements were made along the compression and heating paths indicated by the light-blue arrows.

