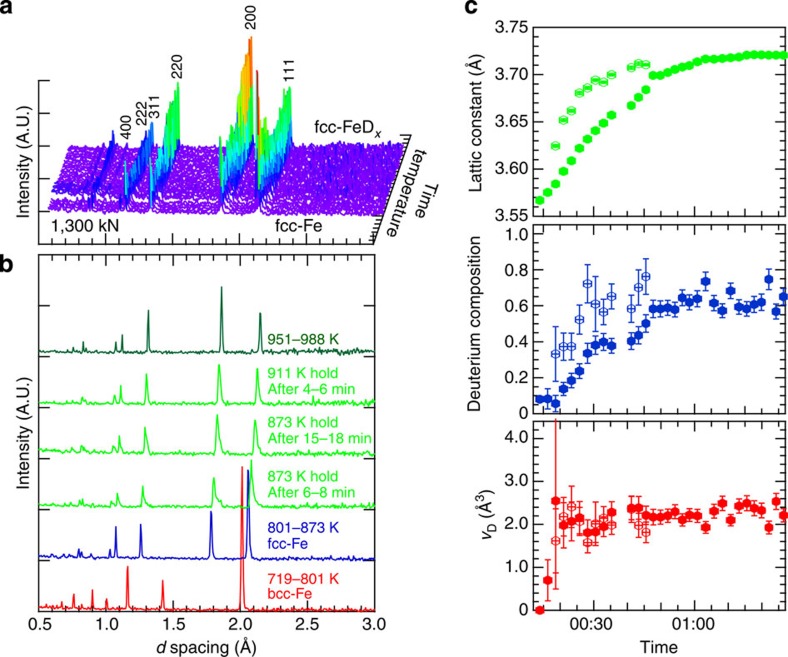
Figure 3. Neutron diffraction profiles and obtained parameters.
(a) Neutron diffraction profiles measured with a 2-min accumulation for the deuterization process of fcc Fe at an initial pressure of 7.4 GPa. The profiles of bcc Fe are omitted to clearly display the profile change due to deuterization. (b) Selected profiles showing bcc–fcc transition of Fe and successive deuterization of fcc-Fe. (c) Lattice constant a (top), D composition x (middle) and volume expansion rate vD (bottom) plotted with time after the start of deuterization. Solid and open circles represent the parameters derived with the refinement analysis using the dominant and shoulder peaks, respectively. Errors are estimated based on the s.d. of Rietveld analysis.

