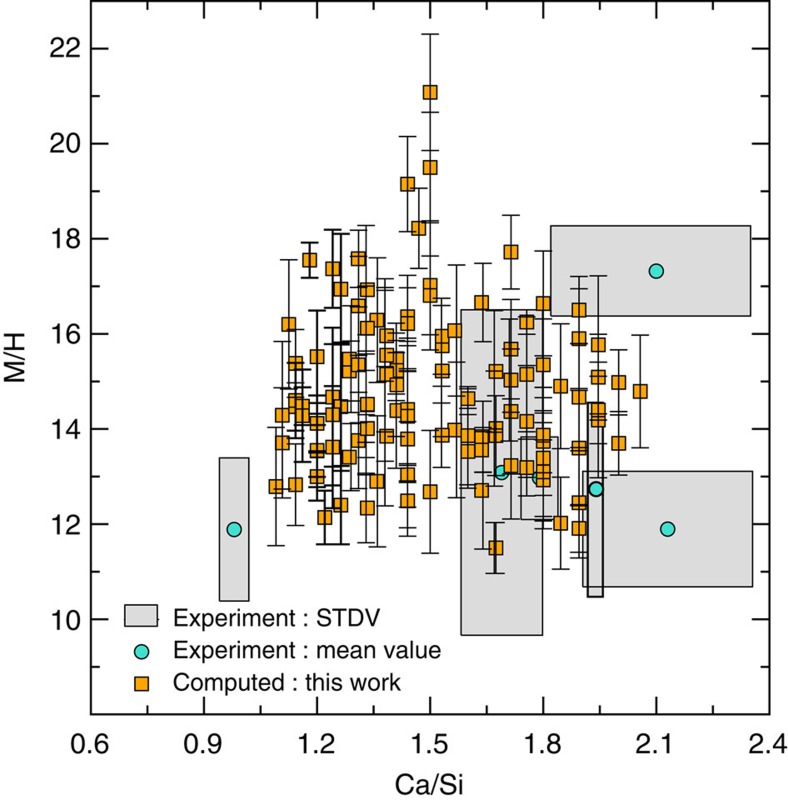
Figure 4. M/H as a function of C/S ratio.
The simulation results were computed with a non-reactive potential at 0K, and are compared against experimental data. Experimental M/H are shown as mean (points) and uncertainty (gray boxes) calculated by assuming M and H are normally distributed independent quantities that are each characterized by a standard deviation. See Supplementary Methods. For the sake of clarity, this graph shows one fewer experimental data point than in Fig. 3a, at C/S~1 with M/H~8; see Supplementary Table 6.

