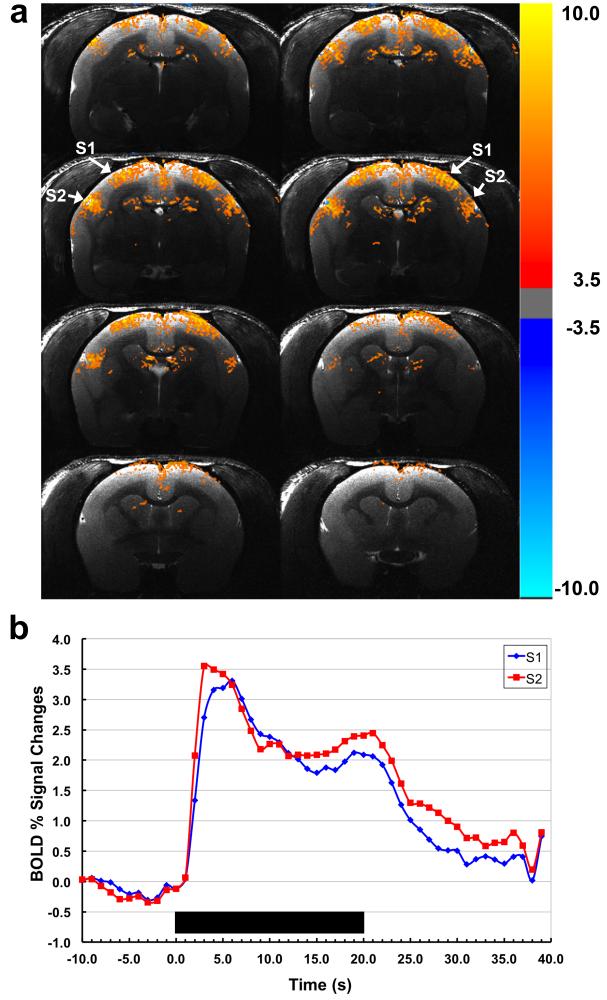
Figure 9.
(a) BOLD activation maps obtained from a conscious awake marmoset in response to somatosensory stimulation using the embedded 4-channel array coil. The arrows show the two main regions of activation in the somatosensory cortex, S1 and S2. (b) Normalized averaged time courses showing BOLD signal changes in S1 and S2 (blue and red, respectively). Duration of the stimulation period is indicated by the black bar.

