
Figure 2.
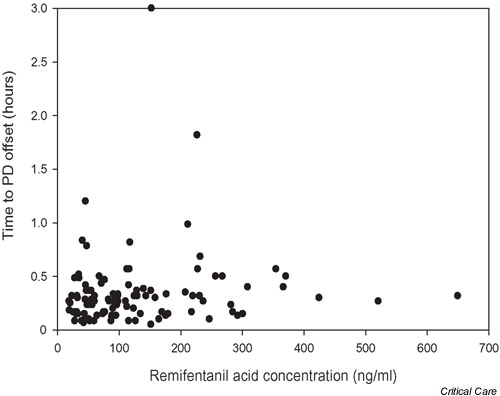
Scatter plot of time to the offset of pharmacodynamic (PD) effects versus remifentanil acid concentrations at the start of down-titration.
Official websites use .gov
A
.gov website belongs to an official
government organization in the United States.
Secure .gov websites use HTTPS
A lock (
) or https:// means you've safely
connected to the .gov website. Share sensitive
information only on official, secure websites.
Scatter plot of time to the offset of pharmacodynamic (PD) effects versus remifentanil acid concentrations at the start of down-titration.