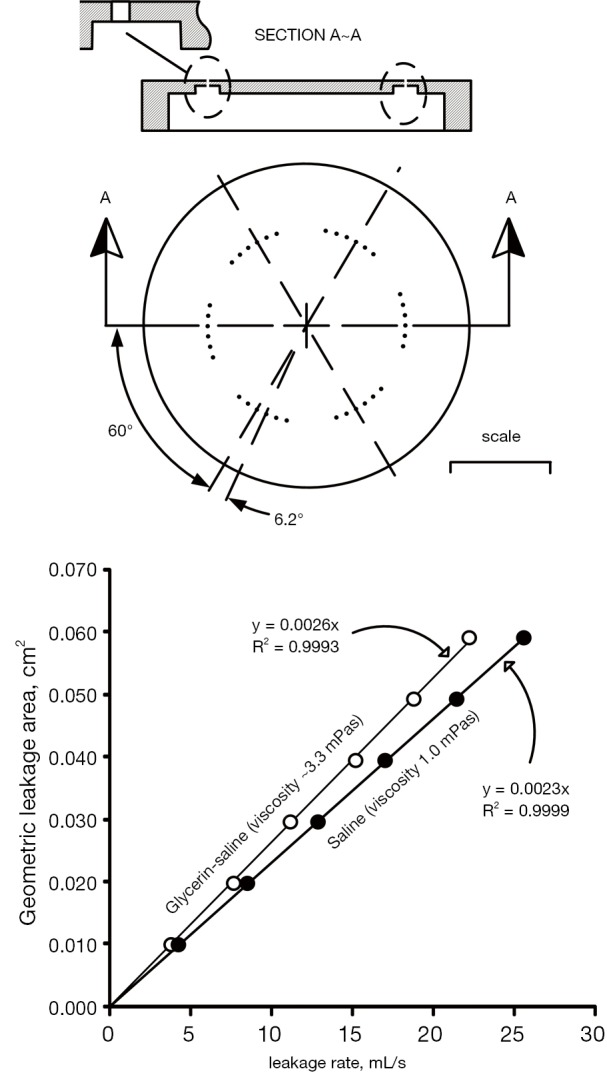
Figure S4.

Diagram of leakage orifice (top panel) and calibrations for fluids with different viscosity (saline and glycerin-saline). The six sets of holes were sequentially blocked thus obtaining six data pairs for each calibration line. For very small leakage pathways, the primary determinant of leak flow rate is the total geometric leakage flow area.
