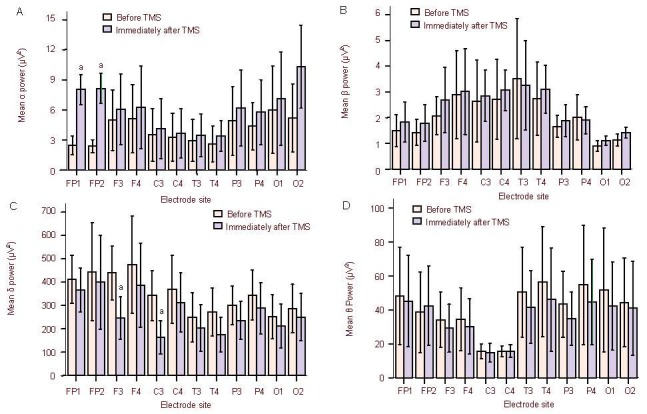
Figure 1.

Absolute power values at α, β, θ, and δ bands in all brain regions of disturbance of consciousness patients immediately after repetitive transcranial magnetic stimulation (rTMS) treatment. Data are presented as mean ± SD. aP < 0.05, vs. before treatment (paired samples t-test).
(A) Compared with before treatment, the α band absolute power at Fp1, Fp2, and O2 electrodes was significantly increased immediately after the first rTMS treatment. (B, D) Compared with before treatment, the β band and θ band absolute power values were not increased at each electrode recording sites immediately after the first rTMS treatment. (C) Compared with before treatment, the δ band activity was significantly reduced in the F3 and C3 electrodes immediately after the first rTMS treatment.
