
Figure 3.
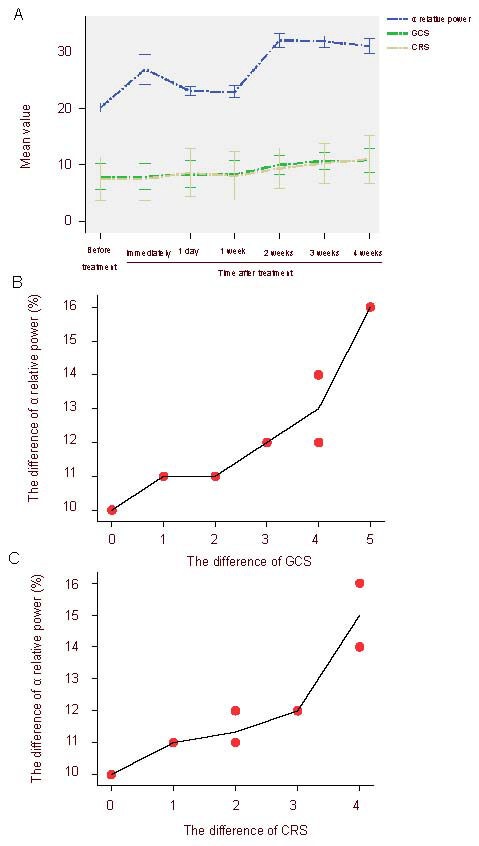
Correlation between the relative power values in the α band and the clinical neurobehaviors after repetitive transcranial magnetic stimulation treatment in patients with consciousness disturbance.
Glasgow Coma Score (GCS) and Coma Recovery Scale-Revised (CRS-R) score showed statistically significant differences at 2 weeks post-treatment compared with before treatment (P < 0.05). Pearson correlation analysis indicated a positive correlation between relative power value at α band and GCS score and CRS-R score.
(A) Changes of α relative power values and GCS and CRS-R scores at different time points after treatment. (B) The correlation between the difference of α relative power values and the difference of GCS score (the differences between 2 weeks post-treatment and before treatment) (r = 0.900, P < 0.001). (C) Correlation between the difference of α relative power values and the difference of CRS-R score (the differences between 2 weeks post-treatment and before treatment) (r = 0.892, P < 0.01).