Figure 5.

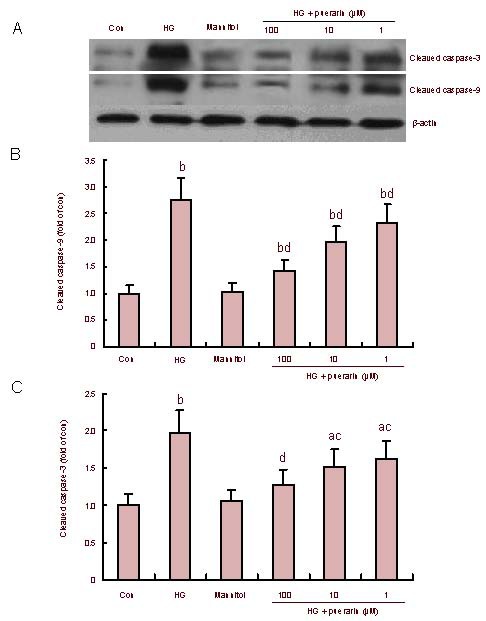
Effect of puerarin on caspase-3 and caspase-9 activation in Schwann cells treated with high glucose (HG; western blotting).
(A) Representative images.
(B, C) Quantitative analysis of cleaved caspase-9 and cleaved caspase-3. Data are representative images or expressed as mean ± SEM of each group of cells from three separate experiments and the value of the control cells was designated as 1. aP < 0.05, bP < 0.01, vs. control; cP < 0.05, dP < 0.01, vs. HG.
