Figure 2.
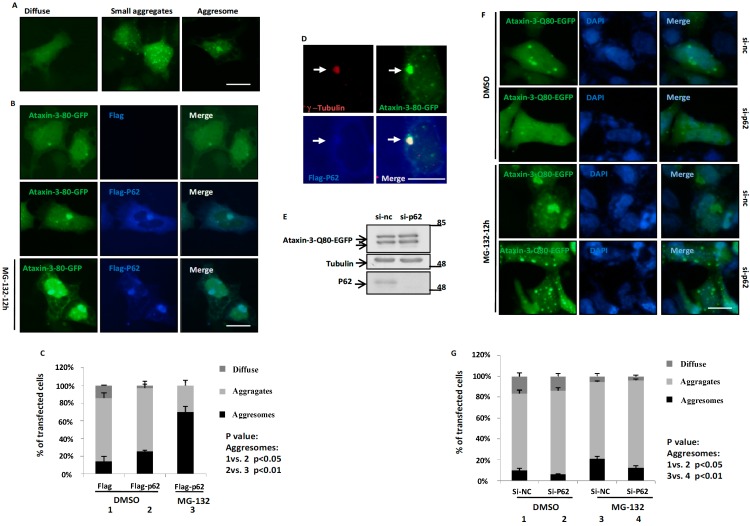
p62 promotes the aggresome formation of ataxin-3-Q80. (A) The three distinct distribution patterns of ataxin-3-Q80-EGFP in HEK293 cells. Ataxin-3-Q80-EGFP was transfected into HEK293 cells for 48 h, and then visualized using an invert fluorescent microscope. The scale bar indicates 10 µm; (B) Ataxin-3-Q80-EGFP and Flag or Flag-p62 were transfected into the HEK293 cells for 48 h, and then treated with DMSO or MG-132 (10 µM) for another 12 h. Finally, the cells were fixed and subjected to immunofluorescent assay with anti-Flag antibody (blue). The scale bar indicates 10 µm; (C) The three distinct distribution patterns of ataxin-3-Q80-EGFP in (B) are quantified. Three independent experiments were performed and the data are indicated as the means ± S.E.M; (D) HEK293 cells were transfected with EGFP-ataxin-3-80Q and FLAG-p62 for 48 h, and then treated with MG132 (10 µM) for another 12 h. Subsequently, the cells were subjected to immunofluorescent assay using anti-γ-tubulin (Red) and p62 (blue) antibodies. The scale bar indicates 10 µm; (E) Knockdown of p62 in HEK293 cells. Transfect the si-nc or si-p62 siRNA (1# plus 2#) into HEK293 cells for 72 h, the cell lysates were subjected to immunoblot analysis using anti-p62 and anti-tubulin antibodies; (F) HEK293 cells were transfected with si-p62 (1# plus 2#) or si-nc siRNA. After 12 h, cells were transfected with ataxin-3-Q80-EGFP for 48 h, and then treated with DMSO or MG-132 (10 µM) for 12 h. At last, the cells were fixed and subjected to immunofluorescent assay at 72 h. The cells nuclei were stained with DAPI. The scale bar indicates 10 µm; (G) The three distinct distribution patterns of ataxin-3-Q80-EGFP in (F) are quantified. Three independent experiments were performed and the data are indicated as the means ± S.E.M.

