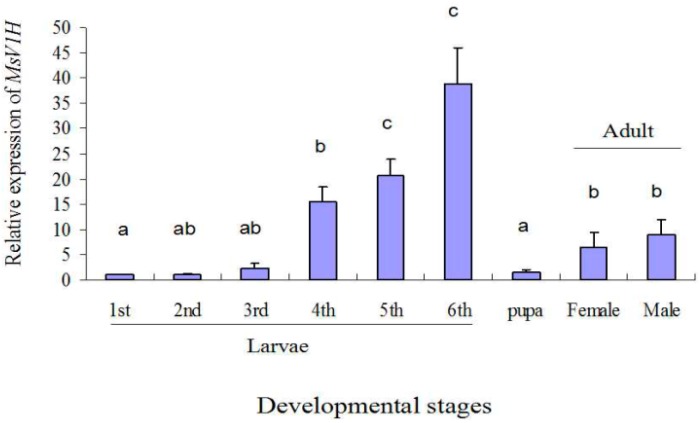
Figure 3.
Relative expression level of M. separata MsV1H in different developmental stages. Expression level was normalized using β-actin as the standard. The normalized value was applied to relative expression analysis. The results are shown as the mean ± SE. The error bars show the ranges of standard errors. Letters on the error bars indicate the significant differences by ANOVA analysis (p < 0.05).

