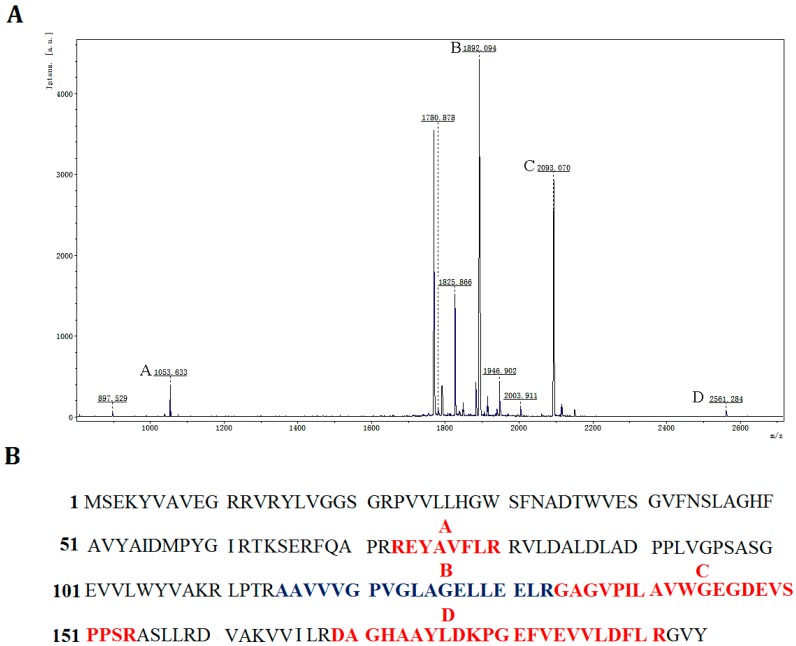
Figure 5.
Identification of rP186_1588 by peptide mass fingerprinting analysis. (A) MALDI-TOF spectra of rP186_1588, x-axis: m/z ratio; y-axis: species abundance in terms of percent signal intensity. Major peaks corresponding to the predicted peptides are marked as A, B, C, and D; (B) The peptide fragments of rP186_1588 whose molecular weights correspond to those of the peaks shown in the peptide mass fingerprint.

