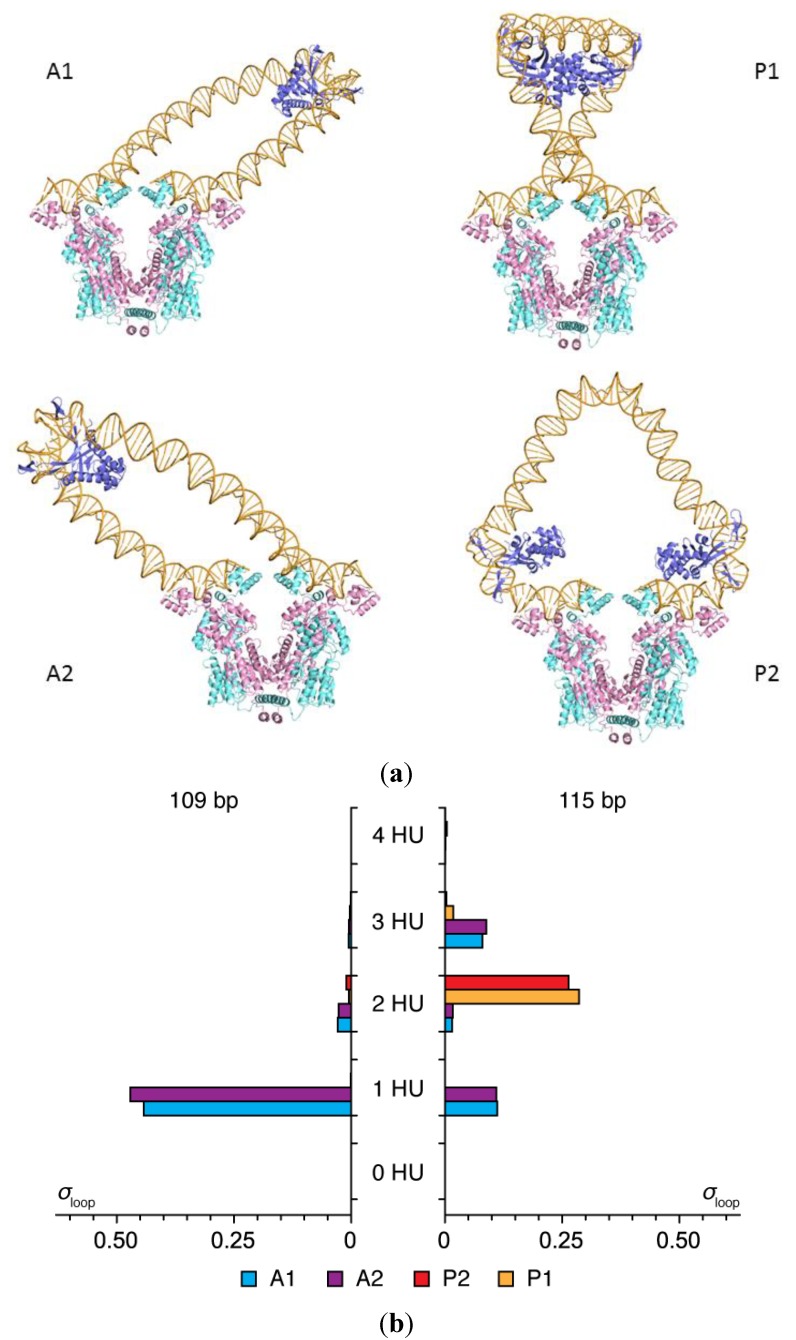
Figure 2.
Effects of DNA chain length on the orientation of DNA and the simulated uptake of HU on loops anchored to the Lac repressor. (a) Molecular images illustrating the predominant configurations of DNA and the positions of HU on 109 bp (left) and 115 bp (right) loops. Images rendered in PyMOL [22] with DNA backbones are shown as gold tubes, DNA bases as gold sticks, HU chains as blue ribbons, and repressor chains as pink and cyan ribbons. Views looking down the axis perpendicular to the long axes of the globular arms of the repressor; (b) Frequencies of occurrence σloop of the four possible looped forms. Note the marked shift in loop orientation (A1/A2→P1/P2) and HU uptake (1→2) with the increase in operator spacing, the straight segments of DNA in the models, and the potential (highly curved) site for a third HU at the center of the P2 loop.

