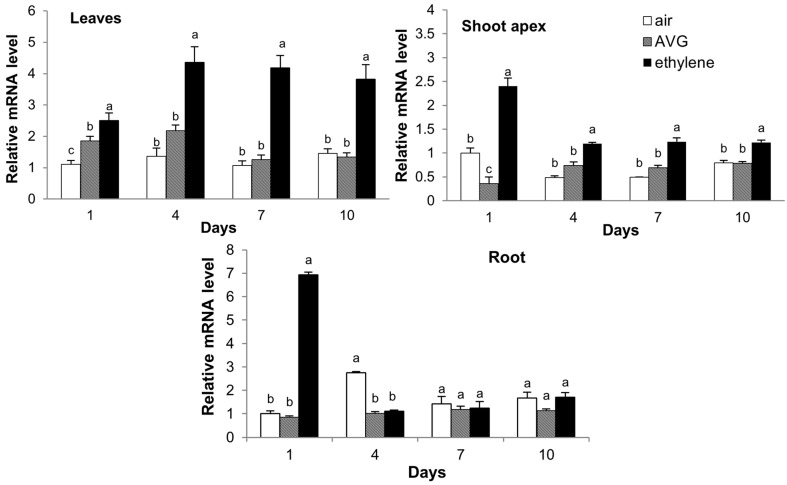
Figure 9.
Expression of CsCTR1 in response to ethylene and 1-aminoethoxyvinylglycine (AVG) treatment. The expression of CsCTR1 in different organs was determined by qRT-PCR at 1, 4, 7 and 10 days after treatment with ethephon or AVG. Error bars on each column indicate standard deviation from three biological replicates. Columns with different lowercase letters are statistically different using the significant difference test of one-way ANOVA (p<0.05).

