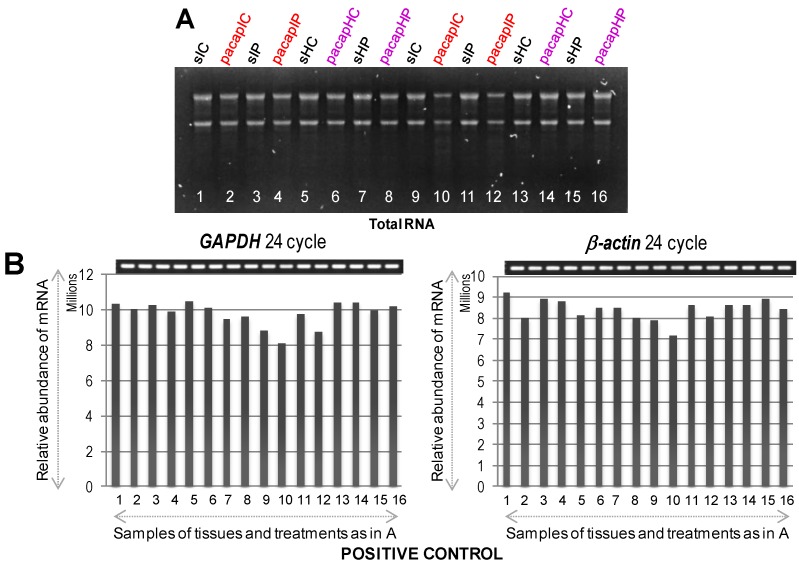
Figure 2.
Total RNA visualized by agarose gel electrophoresis (A) followed by mRNA expression profiles of GAPDH and β-actin genes used a positive control (B) to confirm equal loading and proper cDNA synthesis. In (A), lane numbers 1 to 8 and 9 to 16 indicate 6 and 24 h samples (1/9 = sIC, saline ischemic core; 2/10 = pacapIC, PACAP38 ischemic core; 3/11 = sIP, saline Ischemic Penumbra; 4/12 = pacapIP, PACAP38 ischemic penumbra; 5/13 = sHC, saline healthy core; 6/14 = pacapHC, PACAP38 healthy core; 7/15 = sHP, saline healthy penumbra; 8/16 = pacapHP, PACAP38 healthy penumbra), respectively; and in (B), gel images on top show PCR product bands stained with ethidium bromide; band intensities are also presented graphically below for clarity.

