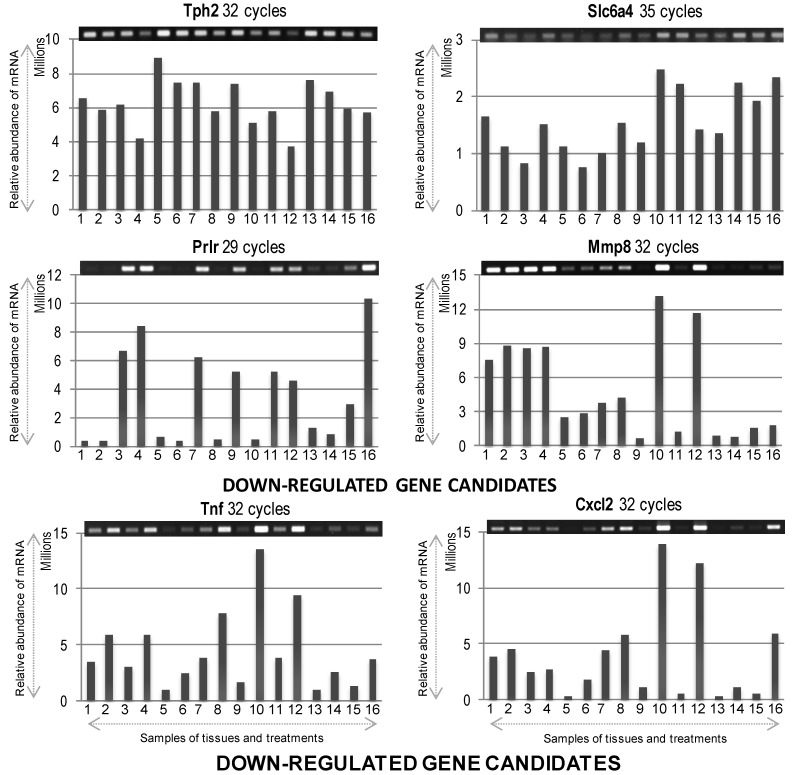
Figure 4.
The mRNA expression profiles of differentially expressed down-regulated genes. Gel images on top show PCR product bands stained with ethidium bromide; band intensities are also presented graphically below for clarity. Lane numbers 1 to 8 and 9 to 16 indicate the 6 and 24 h samples (1/9 = sIC, saline Ischemic Core; 2/10 = pacapIC, PACAP38 Ischemic Core; 3/11 = sIP, saline Ischemic Penumbra; 4/12 = pacapIP, PACAP38 Ischemic Penumbra; 5/13 = sHC, saline Healthy Core; 6/14 = pacapHC, PACAP38 Healthy Core; 7/15 = sHP, saline Healthy Penumbra; 8/16 = pacapHP, PACAP38 Healthy Penumbra), respectively. Semi-quantitative RT-PCR was performed as described in Materials and Methods, and the gene-specific primers are detailed in Table 1.

