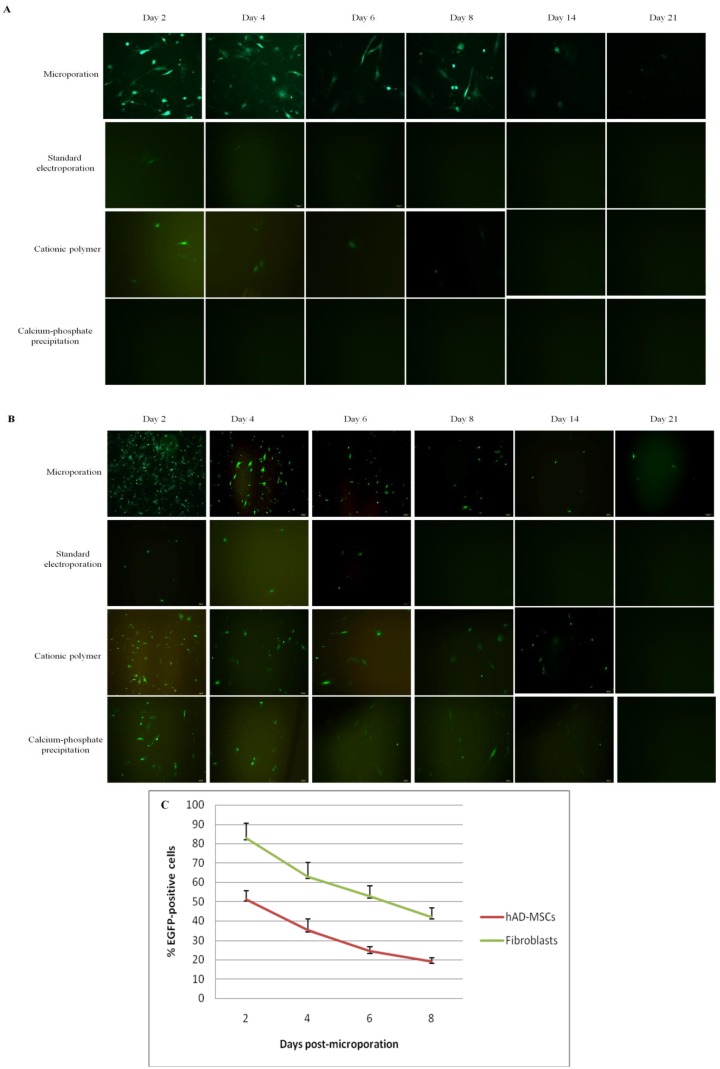
Figure 3.
Time-course analysis of eGFP expression level in hAD-MSCs and fibroblasts. Analysis of eGFP expression of (A) hAD-MSCs and (B) fibroblasts following transfection using the microporation, standard electroporation, cationic polymer, and classical calcium phosphate precipitation techniques over a 21-day period (Magnification: (A) 100× and (B) 100×); (C) Evaluation of eGFP expression in microporated hAD-MSCs and fibroblasts over an 8-day period. The expression of eGFP was detected by fluorescence microscopy at days 2, 4, 6, and 8 following transfection. The number of eGFP-expressing cells began to decline over time.

