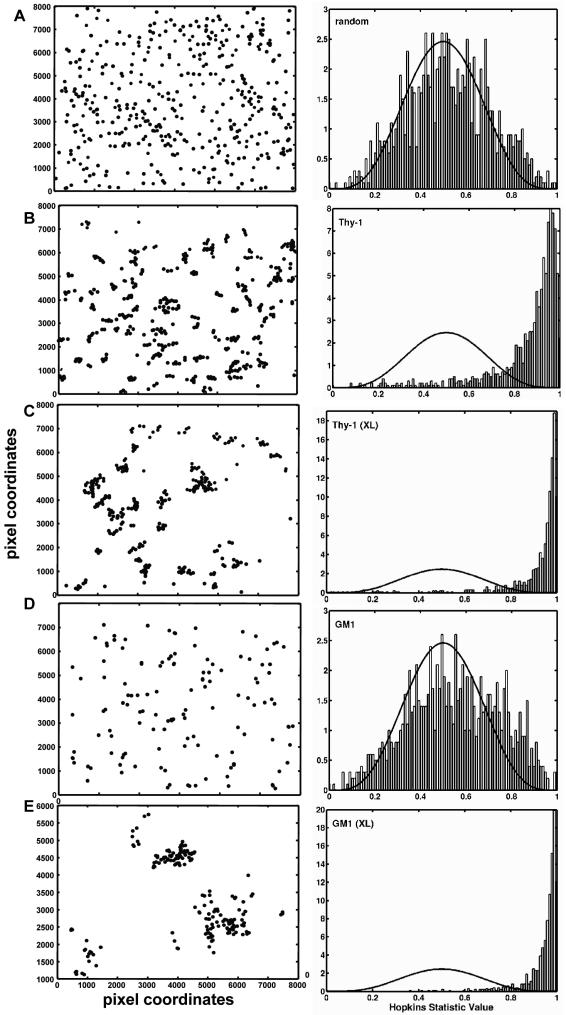
Figure 2.
Analysis of clustering using the Hopkins statistic. (A) Pictogram of 300 computer-generated randomized points is shown at left. The corresponding histogram of the relative frequency distribution (at right) shows Hopkins values centered around 0.5, as expected for a random distribution. (B) Experimental sample demonstrating the inherent distribution of Thy-1 on native membrane sheets. The histogram (at right) shows the Hopkins value is shifted to the right, indicating that Thy-1 is significantly clustered. (C). Same as B, except that Thy-1 was aggregated with anti-Thy-1-gold particles for 10 min at 37°C. The histogram shows a further shift to the right, reflecting an increase in clustering. (D) Experimental sample demonstrating the resting distribution of GM1 on native membrane sheets. The histogram shows an essentially random distribution of GM1. (E) Same as in D, except that GM1 ganglioside was aggregated with biotinyl-cholera toxinavidin-gold for 10 min at 37°C. The histogram shows a high degree of clustering.

