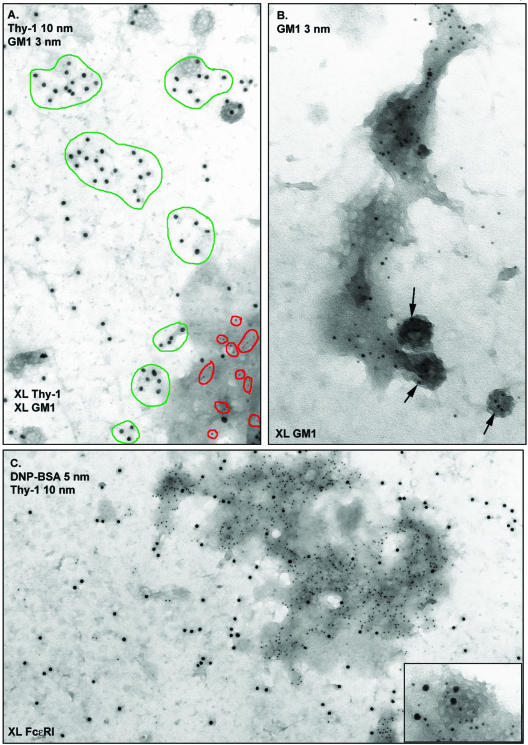
Figure 3.
Distributions of Thy-1 and GM1, with and without external cross-linking. (A) Distinct distributions of aggregated Thy-1 and aggregated GM-1. Cells were incubated for 15 min at room temperature with anti-Thy-1 monoclonal antibody and biotinyl-cholera toxin, followed by 10 min at 37°C with 10-nm anti-mouse-gold and 3-nm avidin-gold to aggregate Thy-1 and ganglioside independently and simultaneously. Aggregated GM1 (red outlines) redistribute to electron dense patches (bottom right). In contrast, Thy-1 clusters (green outlines) show no apparent preference for particular membrane regions. (B) Higher magnification view of a GM1-gold aggregate. Gold particles marking GM1 are again seen in a large dark patch. They are additionally seen in the flat clathrin array (middle) and three clathrin-coated vesicles (arrows) budding from the membrane. (C) Distribution of Thy-1 and cross-linked FcεRI. IgE-primed cells were stimulated for 5 min with DNP-BSA-gold (5 nm) and then fixed and labeled with anti-Thy-1-gold (10 nm). Aggregated receptors marked with small gold are concentrated in an electrondense patch. In contrast, Thy-1 is distributed over the entire membrane. (C, inset) High magnification of coated vesicle from another area on the same sample. Cross-linked FcεRI (small gold) and Thy-1 (large gold) can both enter coated pits.

