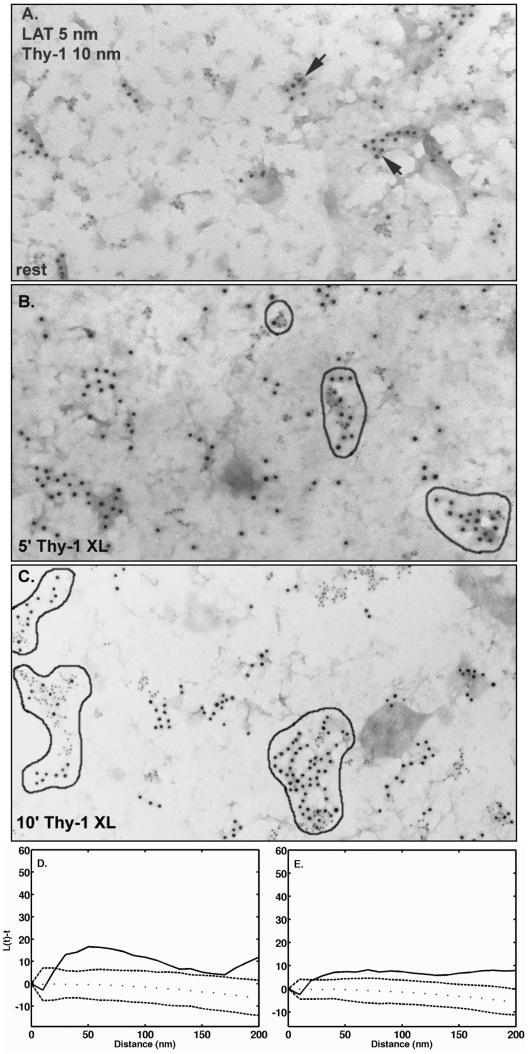
Figure 6.
Coclustering of Thy-1 and LAT is increased after Thy-1 aggregation. (A) Cells were fixed with 2% paraformaldehyde and Thy-1 was labeled from the outside using anti-Thy-1-gold (10 nm). Membrane sheets were prepared and labeled from the inside with anti-LAT-gold (5 nm). Arrows mark clusters containing both sizes of gold. (B and C). Cells were incubated for 15 min at room temperature with anti-Thy-1 monoclonal antibody followed by 5 min (B) or 10 min (C) at 37°C with 10-nm antimouse-gold aggregate Thy-1. Sheets were prepared, fixed, and labeled from the inside with anti-LAT-gold (5 nm). Clusters containing both sides of gold are outlined in black. (D and E). Analysis of the distributions shown in A and C by using the Ripley's K statistic. (D and E). Experimental values for L(t) - t (solid line) fall outside the boundaries predicted for pairwise sets of random points (dotted lines), confirming Thy-1 and LAT colocalization in both resting membranes and in membranes after 10 min of Thy-1 aggregation.

