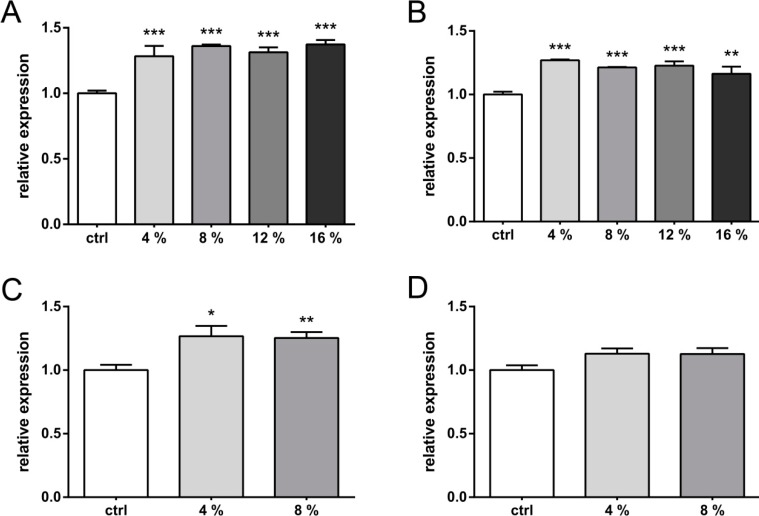
Figure 2.
Strain-dependent VEGF expression in primary chondrocytes. Cells were strained for 12 h with cyclic waveforms and a variety of relative strains. VEGF expression was analyzed directly after straining (t0) (A and C, respectively) or 24 h post stretching (B and D, respectively). The figures show data obtained with square waveforms at 0.5 Hz (A,B) and 1.0 Hz (C,D). Relative percentages of stretching are indicated (i.e., 4%, 8%, 12% or 16%, respectively). Unstrained controls (ctrl) were used to normalize data (set to 1). *, **, and *** indicate significance levels of p ≤ 0.05, p ≤ 0.01, and p ≤ 0.001 respectively, n = 3.

