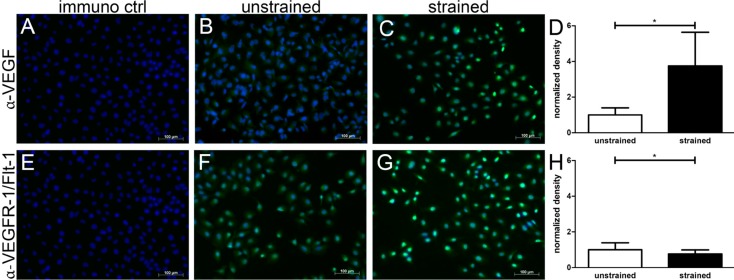
Figure 4.
Expression of VEGF and VEGFR-1 in human chondrocytes.Representative immunofluorescent staining of VEGF and VEGFR-1 in C-28/I2 chondrocytes. Cells were strained for 12 h with cyclic square waveforms at 0.5 Hz and 8% relative stretching. Green Alexa Fluor® 488-specific signals for VEGF (top row) and VEGFR-1 (bottom row) are shown, while nuclei appear in blue (bisbenzimid). Staining control without primary antibody (immuno ctrl: A,E); unstrained cells (B,F), strained (i.e., stretched) cells (C,G). Scale bars represent 100μm. Signal intensity of the anti VEGF staining (D) and VEGFR-1/Flt-1 (H) was quantified by ImageJ. Signal intensity of unstrained cells was set to 1. * indicates p ≤ 0.05, n = 3.

