Figure 5.
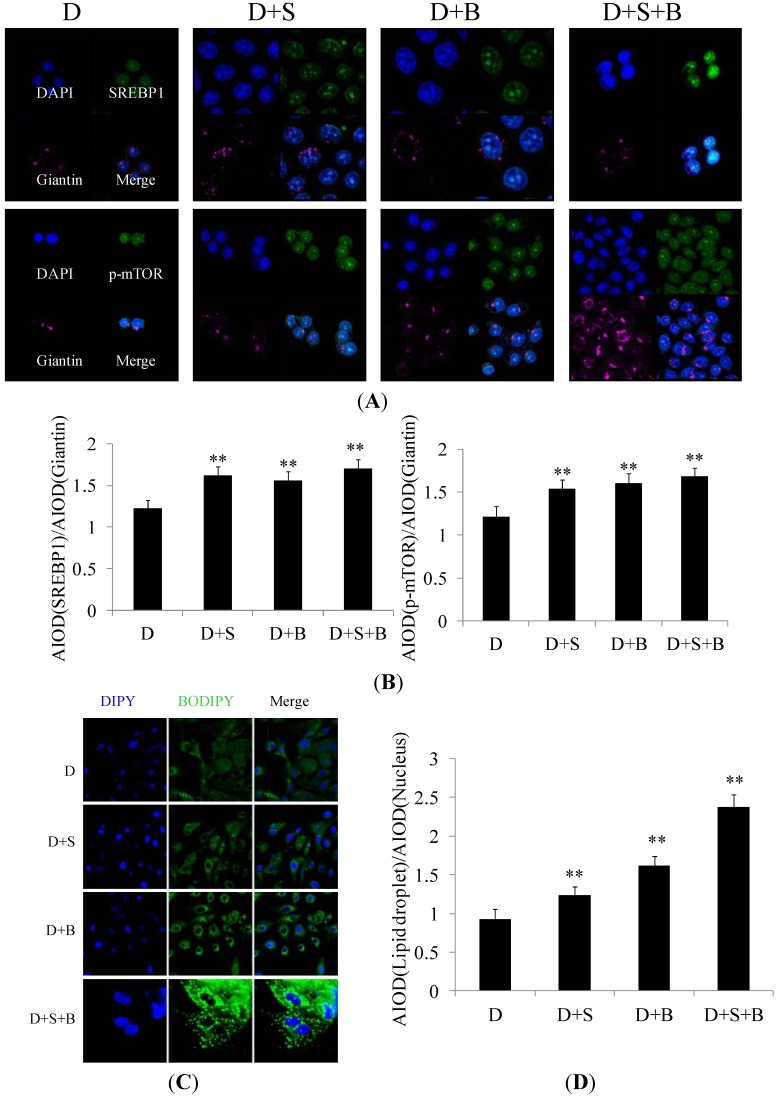
The effect of stearic acid and serum on the subcellular localization of molecules related to milk fat synthesis. Groups of DCMECs were assessed as in Figure 4. (A) Localization of SREBP1 and p-mTOR. SREBP1 (green), giantin (purple), and DAPI (dark blue). Scale bars = 10 μm; (B) Integral optical density analysis of p-mTOR. p-mTOR (green), giantin (purple), and DAPI (blue). Scale bars = 10 μm; and (C,D) Immunofluorescent staining and integral optical density analysis of lipid droplets. Lipid droplet (green) and DAPI (blue). Scale bars = 10, 15, 45 or 60 μm. Values represent means ± SE (n = 3). ** p < 0.01 compared with negative control group.

