Figure 6.
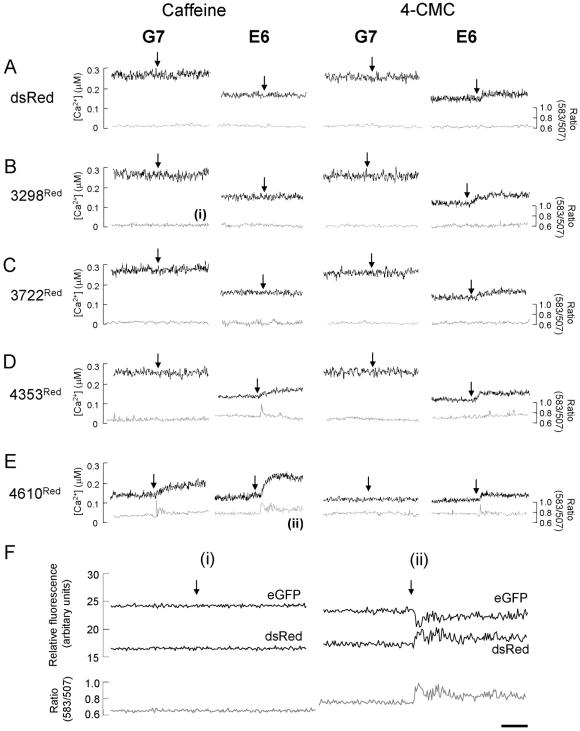
Investigating the functional impact of RyR2 TM and cytoplasmic domain interaction. (A-E) [Ca2+]c in single G7 and E6 cells (black traces) coexpressing dsRed (A), 3298Red (B), 3722Red (C), 4353Red (D), or 4610Red (E) was measured before and after addition of caffeine or 4-CMC (arrowed). In parallel experiments, FRET (ratio 583:507; gray traces) between eGFP and dsRed fusion partners was determined. FRET ratio traces in B (i) and E (ii) are expanded in F. (F) Emission spectra (black traces) of eGFP (507 nm) and dsRed (583 nm) before and after addition of agonist (arrowed) used to derive the FRET ratio (gray traces) in B (i) and E (ii) are shown. Note that the caffeine-induced increase in FRET ratio in E6 cells expressing 4610Red (F (ii)) is associated with decreased eGFP fluorescence and concomitantly increased dsRed fluorescence. Traces shown are representative of >30 imaged “positive” (eGFP and dsRed fluorescent) cells. Bar, 10 s.

