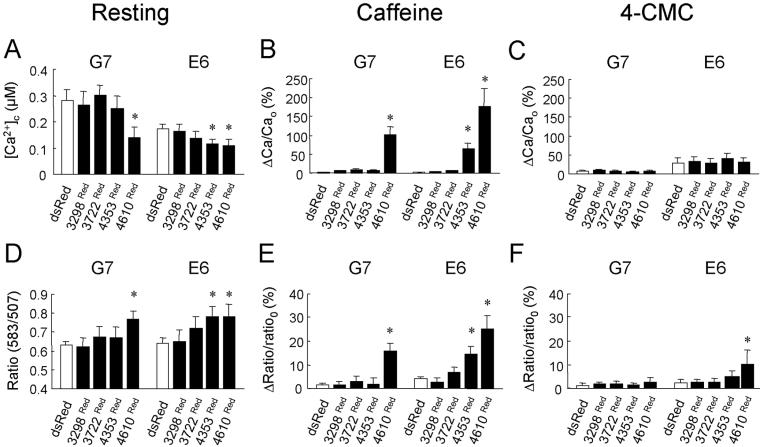
Figure 7.
Interaction between RyR2 cytoplasmic and TM domains modulate intracellular Ca2+ in G7 and E6 cells. (A) Resting [Ca2+]c measured in induced G7 and E6 cells transfected with dsRed, 3298Red, 3722Red, 4353Red, and 4610Red. (B and C) Increases in [Ca2+]c after addition of caffeine (B) or 4-CMC (C) are represented as the percentage peak change in [Ca2+]c (ΔCa) when compared with resting [Ca2+]c (Cao). (D) Basal FRET signals (ratio 583:507) obtained from induced G7 and E6 cells expressing hRyR2 cytoplasmic domains. (E and F) Maximum agonist-induced changes in FRET signals after addition of caffeine (E) or 4-CMC (F) are expressed as the peak change in the FRET ratio (Δratio) when compared with the resting FRET ratio (ratioo). All experimental values are plotted as means ± SEM (n > 30 cells) where the asterisk represents p <0.01 when compared with G7 or E6 cells expressing untagged dsRed.

