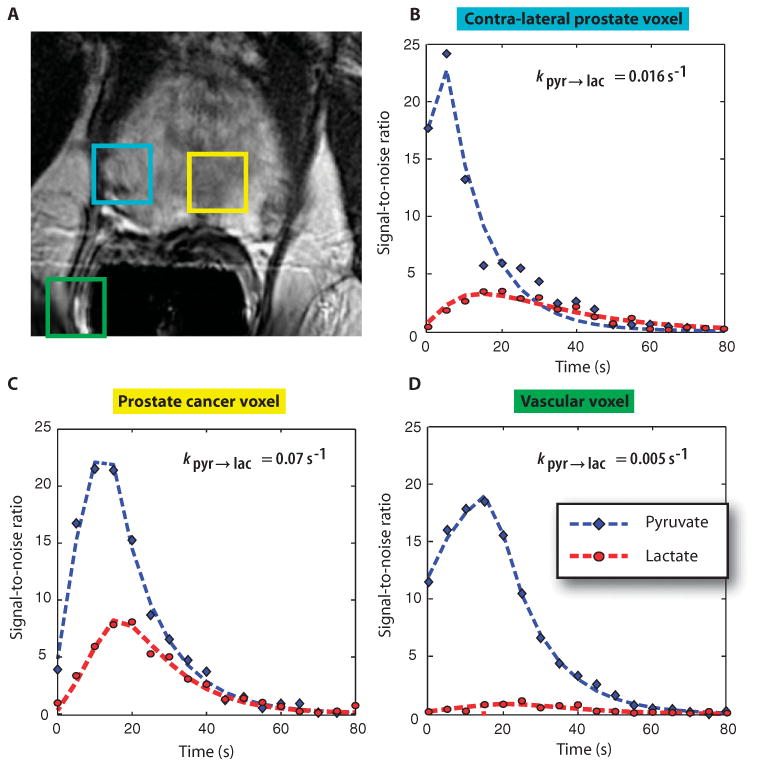
Fig. 3. 2D 13C dynamic MRSI data.

Images are from a representative patient with a current PSA of 3.6 ng/ml, who had biopsy-proven prostate cancer in the left apex (Gleason grade 3 + 4) and received the highest dose of hyperpolarized [1-13C]pyruvate (0.43 ml/kg). (A) A focus of mild hypointensity can be seen on the T2-weighted image, which was consistent with the biopsy findings. (B to D) 2D localized dynamic hyperpolarized [1-13C]pyruvate and [1-13C]lactate from spectral data that were acquired every 5 s from voxels overlapping the contralateral region of prostate (turquoise), a region of prostate cancer (yellow), and a vessel outside the prostate (green). The dynamic data were fit as described previously (22).
