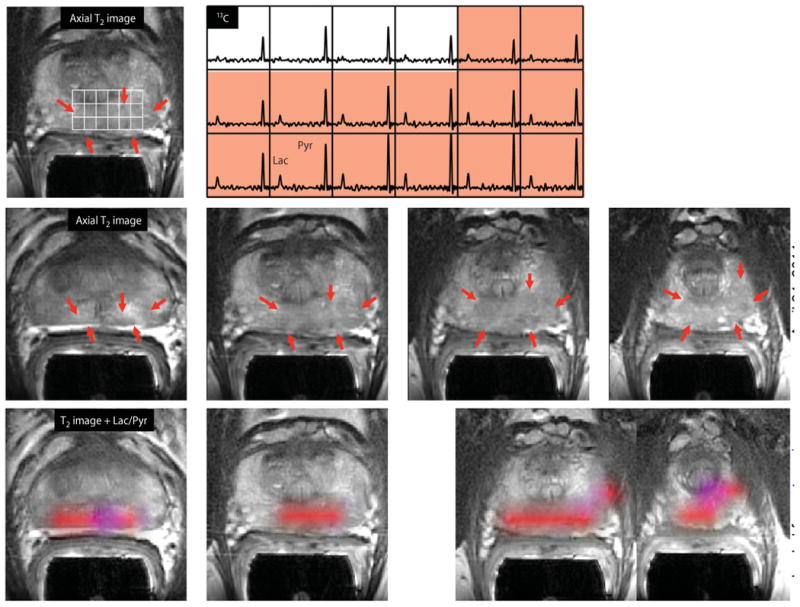
Fig. 5. 3D single–time point localized MRSI data.

Images were obtained from patient A in Table 2, who had a serum PSA of 4.5 ng/ml, was originally diagnosed with bilateral biopsy-proven Gleason grade 3 + 3 prostate cancer, and received the highest dose of hyperpolarized [1-13C]pyruvate (0.43 ml/kg). The upper panel shows an axial T2-weighted images and corresponding spectral array with the area of putative tumor highlighted by pink shading. A region of tumor was observed on the T2-weighted images (red arrows), as well as on ADC images and 1H MRSI data (fig. S1). A region of relatively high hyperpolarized [1-13C]lactate was observed in the same location as the abnormalities that had been observed on the multiparametric 1H staging exam. The lower panels show axial T2 images with and without metabolite overlays for different axial slices from the same patient. The colored regions in these overlays have a ratio of [1-13C]lactate/[1-13C]pyruvate ≥0.2. These demonstrated a large volume of bilateral cancer.
