
Fig. 6. Further representative examples of 3D single–time point MRSI data.
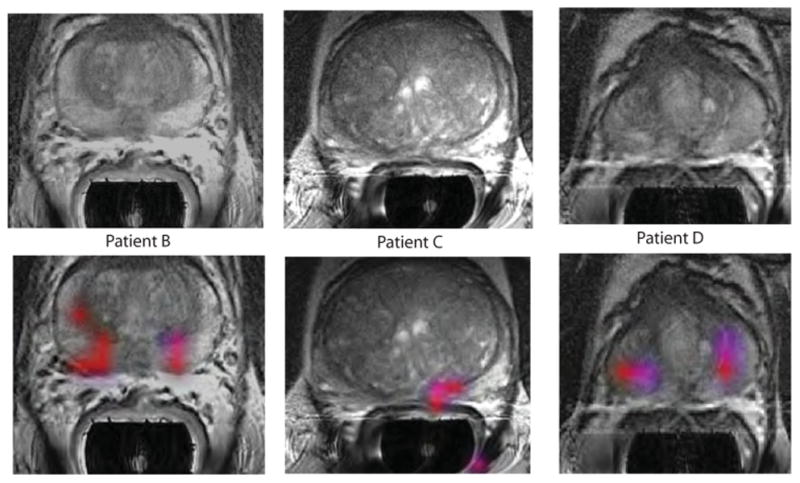
The axial T2-weighted images and overlays of hyperpolarized [1-13C]lactate/[1-13C]pyruvate are from the three patients labeled as B to D in Table 2. All three of the patients had biopsy-proven Gleason grade 3 + 3 prostate cancer and received the highest dose of hyperpolarized [1-13C]pyruvate (0.43 ml/kg). Patient B had a current PSA of 5.1 ng/ml, patient C had a PSA of 9.8 ng/ml, and patient D had a PSA of 1.9 ng/ml. The SNR and metabolite ratios in the regions highlighted in color on the image overlays are given in Table 2.